Sarah McLean
,
Lead Content Manager
Author
, Published on
March 23, 2026
Patrick Sanguily
,
Spinergie General Manager Americas
Co-Author

How tugboat fleet operators use our integrated sensor data, advanced analytics, and real-time performance metrics to eliminate downtime, optimize fuel use, and cut operating costs.
.webp)
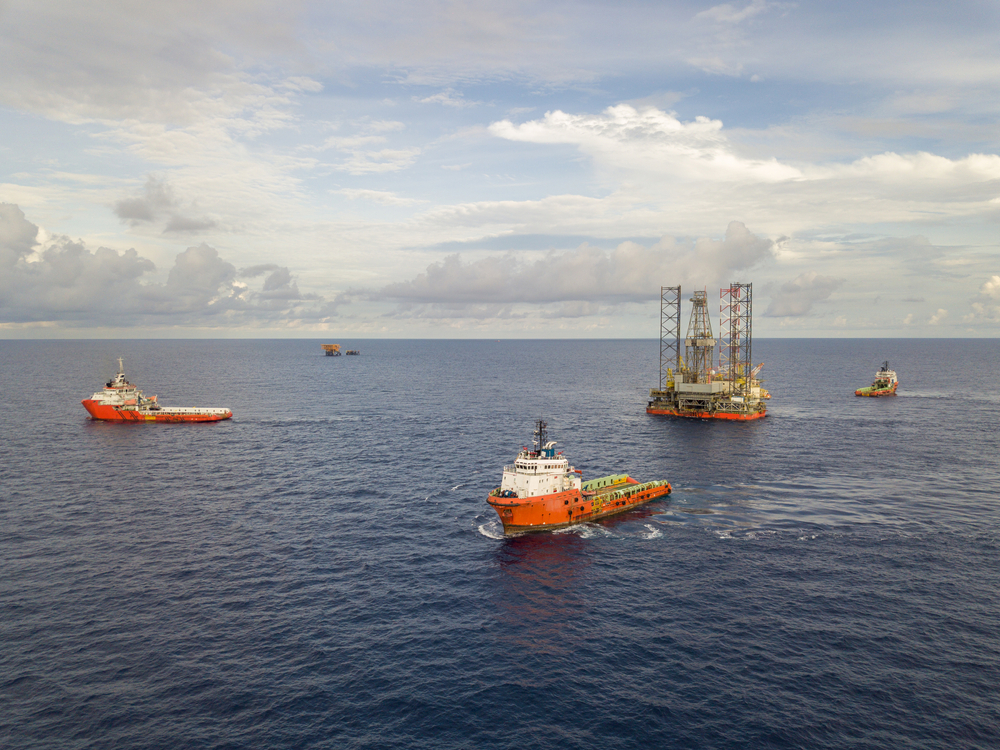
Excessive downtime through repair or unplanned maintenance causes more than delays for tugboat operators—it means lost revenue, customer frustration and extra repair costs. Fleet reliability is critical for sustained high performance and competitiveness.
Technical and engineering managers need to understand how engines are utilized while their boats are performing work. Higher-than-expected power demand can accelerate maintenance intervals, or worse, lead to breakdowns. But, by monitoring power demand and engine load during ship assist, maneuvering, docking, undocking, and towing, operators gain critical insights to proactively manage vessels and maintain long-term reliability. Meanwhile, fleet managers can use this data to match the right assets to the right jobs and ensure that captains are running the engines optimally.
Reliance on engine manuals or operational assumptions based on historical norms is an incomplete approach. When managers take a data-driven approach to each job, they are making decisions that reflect how their fleet is actually utilized.
An analytical approach is a complicated exercise but the first step is data collection. Tugboat operations generate valuable data points every second from sources such as digital vessel reports, GPS/AIS, and propulsion equipment data logs. But where does this data go? Quite often it is filtered into silos where its potential is severely limited.
Spinergie’s Smart Fleet Management (SFM) solution consolidates and contextualizes these data points to help managers reach the right conclusions about vessel performance. Automation means that insights are sent directly to managers for their consideration.
In this article, we share how Spinergie’s customers are merging operational information with equipment data feeds to make data-driven decisions that increase the performance and reliability of their assets.
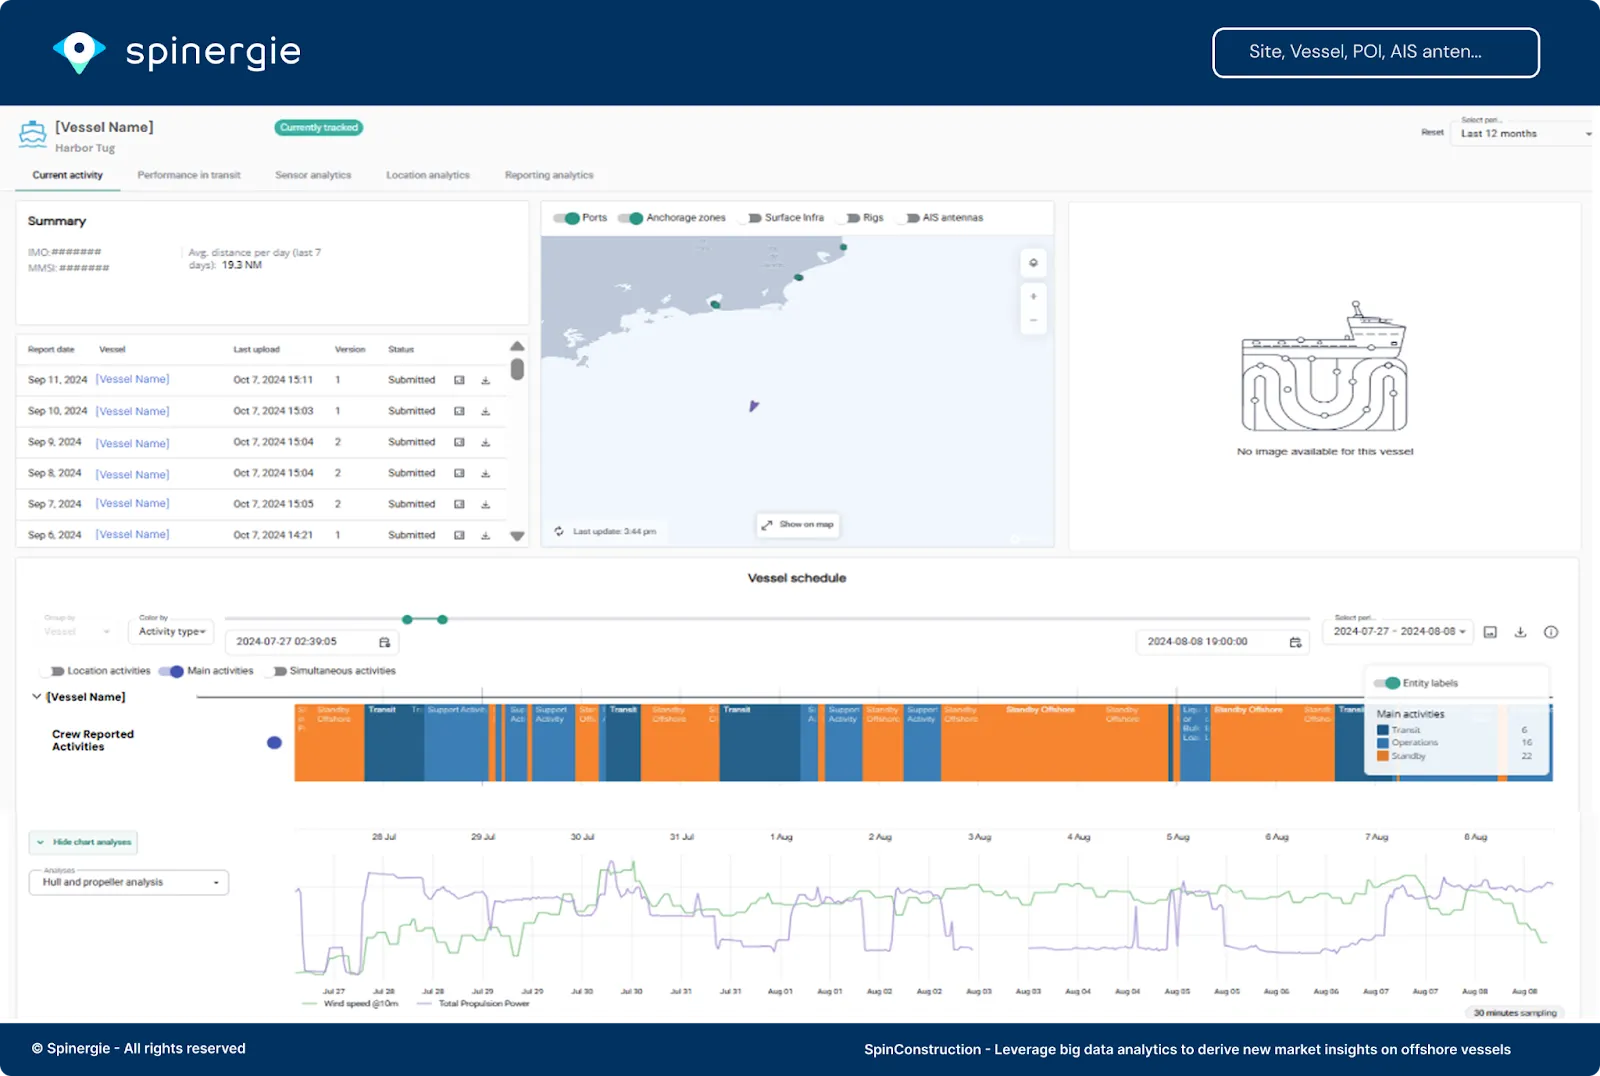
SFM provides technical managers with the analytical horsepower they need for data-driven fleet reliability programs. While it is increasingly common for fleet managers to have access to data from onboard equipment, this information is often standalone. SFM automatically consolidates this data from onboard equipment along with data from other sources - AIS/GPS, vessel reports, weather sources, and more - into an accessible, user-friendly and centralized platform.
The solution processes vessel sensor readings and displays them in ways that consider the surrounding operational context. Users can view data feeds from generators, Z-drives, and fuel sensors alongside vessel activity logs to view performance during towing activities and transits. The user can even replay the vessel tracks corresponding to a specific activity to better understand how vessel positioning and maneuvers correlate to the readings.
To support the user with instant insights, SFM offers configurable metrics that run calculations against sensor data during each job. For example, users can see the “max sustained load” for every job to enable quick benchmarking and spot outliers.
Users can answer questions such as:
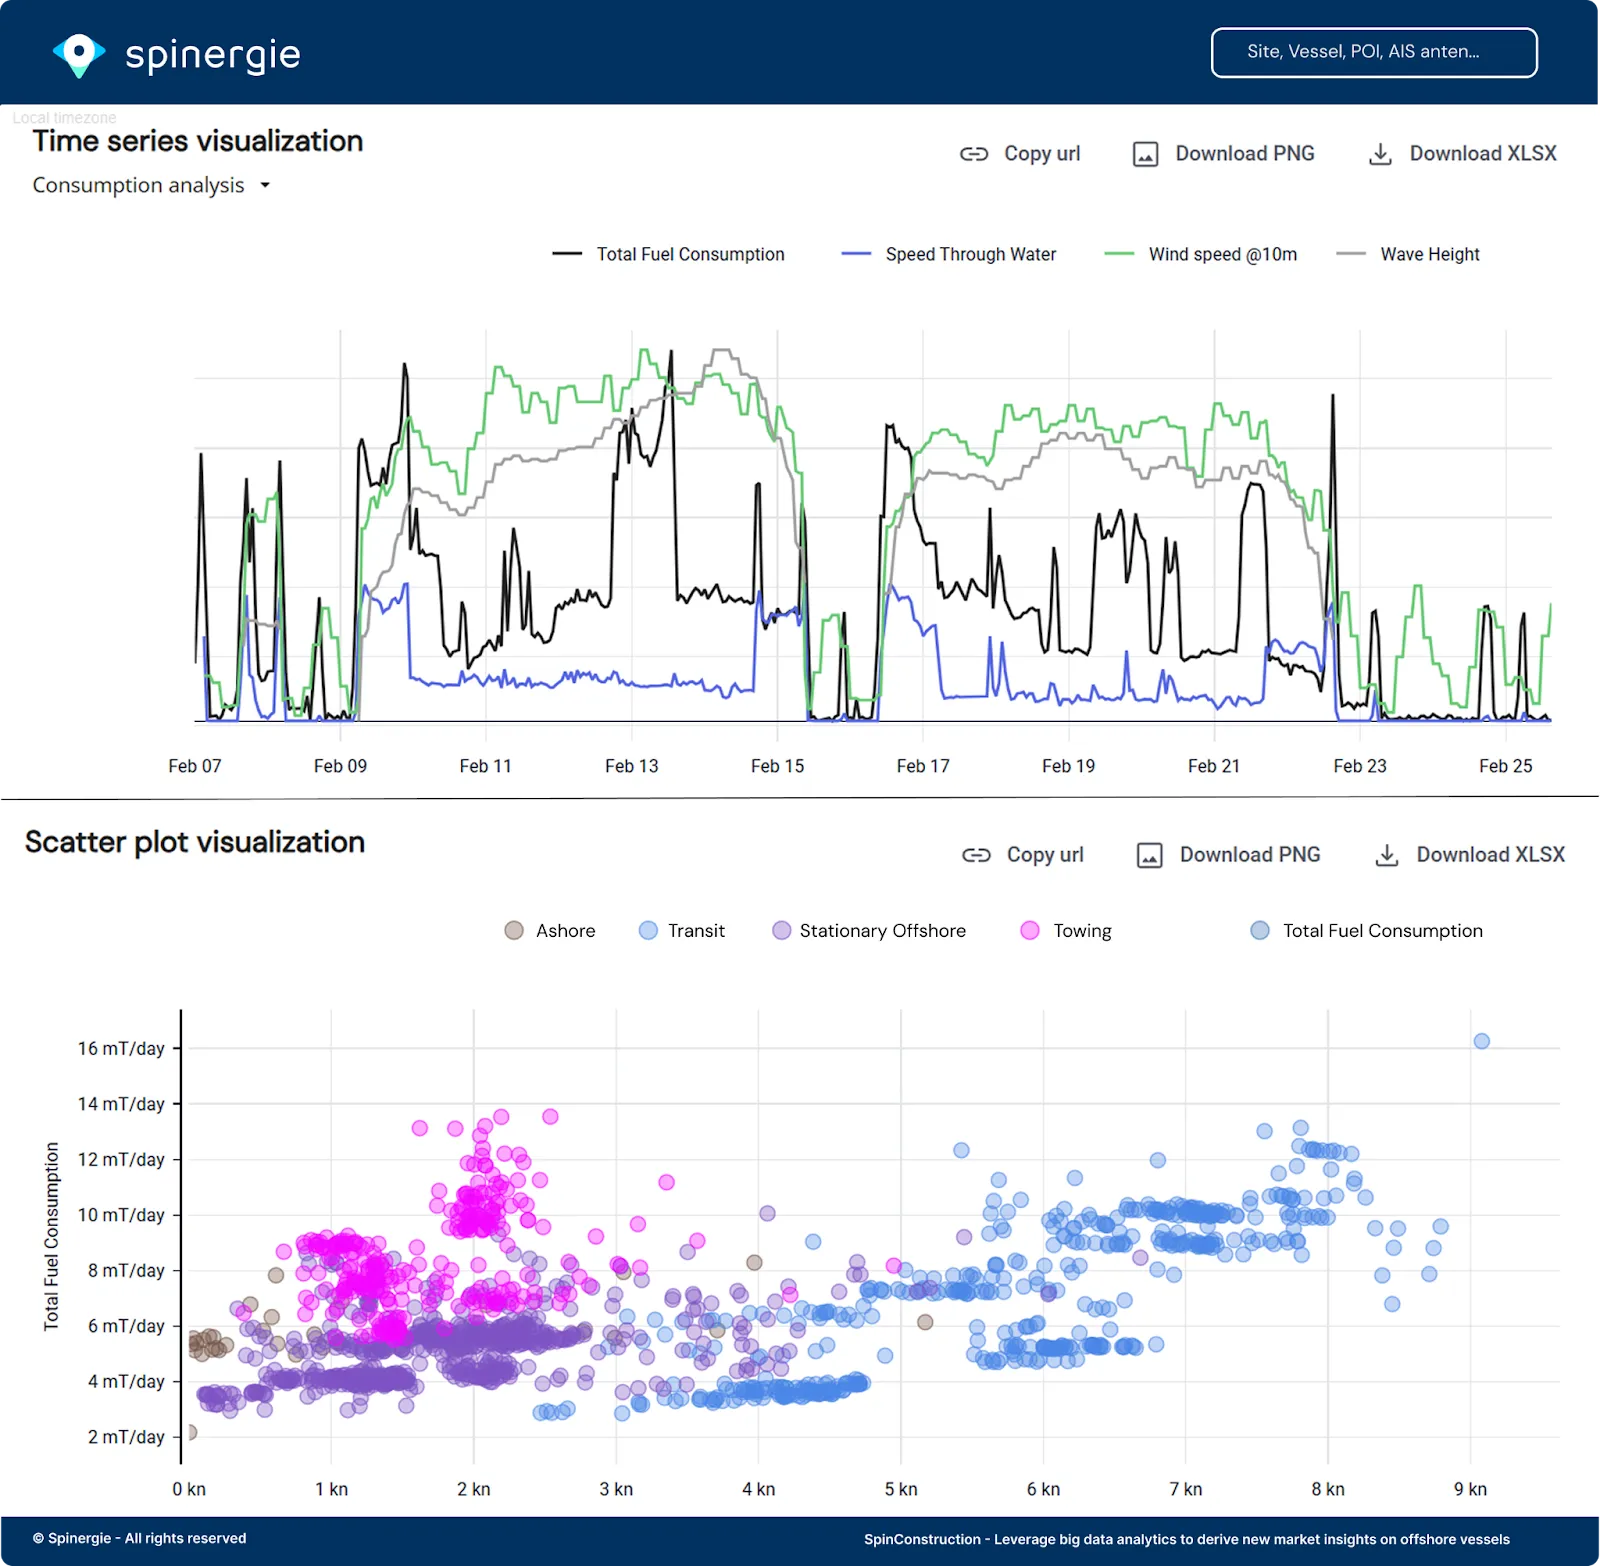
For managers who want to dive further into their data, Spinergie provides advanced sensor visualization tools to support investigations. Users can compare many different data tags in timeline views and scatter plots.
Scatter plots clearly show the relationship between different data points. Additional features allow users to plot various data tags along the x and y-axis of the chart and even color by another variable.
Time series charts monitor fluctuations in data points over time.
Key Features
Continuous insights allow technical managers to proactively identify equipment stress or failure risks. By pinpointing operational stressors before they become critical failures, unplanned maintenance is significantly reduced. With costly downtime minimized, managers can ensure greater fleet reliability.
Deep insights from multiple integrated sources help technical managers precisely analyze fuel consumption across different activity modes. Built-in visualization tools are key in highlighting any inefficiency points. This combined analysis is used to reduce consumption from mis-allocated assets, overloaded assets or inefficient operations.
Instead of relying on fixed maintenance intervals or historical assumptions, SFM enables managers to understand when to undertake predictive maintenance. By optimizing operational efficiency, asset lifecycles are extended while fuel costs and the risk of emergency repairs are reduced.
The challenge isn’t the availability of data, it’s making sense of it. Through contextualized data you gain a better understanding of what impacts your fleet performance and why. This understanding leads your team in making the move from reactive to proactive decision-making. With this foundation you will benefit from improved reliability, fuel efficiency, and economic performance of the fleet.