Your Solution for Complete Offshore Market Visibility

Leverage maritime data and intelligence to support your commercial decisions and plan your operations

Get a product tour
Personalized walkthrough · Your questions, answered

Trusted by leading companies across industries.

Parkwind
General Eletric
Seaway
SSE
Eneos
Gac
Equinor
Scottish Power
Geoxyz
Damen
Bibby
Telford
Jumbo
Semco
Neptune Energy
Parkwind
General Eletric
Seaway
SSE
Eneos
Gac
Equinor
Scottish Power
Geoxyz
Damen
Bibby
Telford
Jumbo
Semco
Neptune Energy
Parkwind
General Eletric
Seaway
SSE
Eneos
Gac
Equinor
Scottish Power
Geoxyz
Damen
Bibby
Telford
Jumbo
Semco
Neptune Energy

Support your decisions with unbiased vessel KPIs and Market insights

Graphic of a ship with data icons including a pie chart, a bar chart, and a speech bubble with lines representing text, symbolizing vessel intelligence or data analytics.

The most exhaustive vessel coverage of the market

Screen and benchmark vessels, analyze offshore vessel market, and get exclusive & unbiased insights to support every commercial and chartering decision.

Access the largest offshore vessel database - 15k+ vessels with 100+ specs & capabilities to filter
Select and compare the best-fit vessel for your project
See short to mid-term vessels availability
Evaluate market size and shares accross and keep an eye on industry players
Monitor offshore fleet utilization rates to spot tightening demand and revenue opportunities
Three offshore wind turbines with spinning blades above stylized water, with a wind symbol indicating wind blowing.

Track, analyze, compare and forecast wind farm projects

Deep-dive into wind farm projects, benchmark installation and O&M performance, and forecast future demand

Track, compare and access full schedules for all past, current and announced wind farm projects
Benchmark turbine, foundation and array-cable installation performance, with delay forecasting
Get light and heavy O&M analytics - marine spread, turbine failure analysis and weather-adjusted performance
Track all past and future floating wind projects
Forecast FID, installation and commissionning dynamics, and compare demand vs supply to 2040
Gain wind supply chain transparency across components, manufacturing plants and project-level timelines
Illustration of a blue power cable reel with a cord extending from it, ending in a plug and a circular yellow connector with a lightning bolt symbol.

Track, analyze & forecast offshore power cable installations and repairs

A complete view of the subsea cable market - projects, laying and repair performance, and forward-looking supply & demand

Access a continuously updated database of all active and planned subsea power cables, fully filterable
Analyze cable-laying performance across players and cable types for export & array cables
Monitor and benchmark cable repair activity and maintenance demand
Forecast supply & demand across array cables, export cables and interconnectors
Look up cable specifications, supply-chain dates, contractual structures and manufacturing facilities
Illustration of an offshore oil rig platform standing on three pillars in the ocean with a crane on the right side holding a hook.

Track, analyze and forecast offshore oil & gas projects

Monitor field developments, pipelay activity, the OSV market and the FPSO & rig fleet in one workspace.
Track field developments through every stage
Benchmark rigid pipelay performance by project, vessel, pipe specification and laying type
Monitor the OSV market and rig support activity
Track the global FPSO fleet and rig market for E&P planning and benchmarking
Four rounded square icons representing shipping and logistics: a crane lifting a load, an electrical plug and socket, a cargo ship, and a crane lifting a shipping container.

Extend your coverage across the wider maritime market

Beyond core offshore segments, track, analyze and forecast adjacent industries and projects

Dredging activity & fleet analysis
Tugs market coverage
Heavy lift cargo (HLC)
Ports & Marshalling activities

Support your decisions with unbiased vessel KPIs and Market insights

Graphic of a ship with data icons including a pie chart, a bar chart, and a speech bubble with lines representing text, symbolizing vessel intelligence or data analytics.

The most exhaustive vessel coverage of the market

Screen and benchmark vessels, analyze offshore vessel market, and get exclusive & unbiased insights to support every commercial and chartering decision.

Access the largest offshore vessel database - 15k+ vessels with 100+ specs & capabilities to filter
Select and compare the best-fit vessel for your project
See short to mid-term vessels availability
Evaluate market size and shares accross and keep an eye on industry players
Monitor offshore fleet utilization rates to spot tightening demand and revenue opportunities

“Spinergie's Smart Fleet Management significantly reduced administrative burdens for SMT Shipping, streamlining regulatory reporting and providing a centralized platform for all operational and technical voyage details.”

Smiling man with short brown hair wearing a light blue collared shirt outdoors, blurred green background.
Joep Groot
Business Optimization & Projects, SMT Shipping
Three offshore wind turbines with spinning blades above stylized water, with a wind symbol indicating wind blowing.

Track, analyze, compare and forecast wind farm projects

Deep-dive into wind farm projects, benchmark installation and O&M performance, and forecast future demand

Track, compare and access full schedules for all past, current and announced wind farm projects
Benchmark turbine, foundation and array-cable installation performance, with delay forecasting
Get light and heavy O&M analytics - marine spread, turbine failure analysis and weather-adjusted performance
Track all past and future floating wind projects
Forecast FID, installation and commissionning dynamics, and compare demand vs supply to 2040
Gain wind supply chain transparency across components, manufacturing plants and project-level timelines

“Spinergie's Smart Fleet Management significantly reduced administrative burdens for SMT Shipping, streamlining regulatory reporting and providing a centralized platform for all operational and technical voyage details.”

Smiling man with short brown hair wearing a light blue collared shirt outdoors, blurred green background.
Joep Groot
Business Optimization & Projects, SMT Shipping
Illustration of a blue power cable reel with a cord extending from it, ending in a plug and a circular yellow connector with a lightning bolt symbol.

Track, analyze & forecast offshore power cable installations and repairs

A complete view of the subsea cable market - projects, laying and repair performance, and forward-looking supply & demand

Access a continuously updated database of all active and planned subsea power cables, fully filterable
Analyze cable-laying performance across players and cable types for export & array cables
Monitor and benchmark cable repair activity and maintenance demand
Forecast supply & demand across array cables, export cables and interconnectors
Look up cable specifications, supply-chain dates, contractual structures and manufacturing facilities

“Spinergie's Smart Fleet Management significantly reduced administrative burdens for SMT Shipping, streamlining regulatory reporting and providing a centralized platform for all operational and technical voyage details.”

Smiling man with short brown hair wearing a light blue collared shirt outdoors, blurred green background.
Joep Groot
Business Optimization & Projects, SMT Shipping
Illustration of an offshore oil rig platform standing on three pillars in the ocean with a crane on the right side holding a hook.

Track, analyze and forecast offshore oil & gas projects

Monitor field developments, pipelay activity, the OSV market and the FPSO & rig fleet in one workspace.

Track field developments through every stage
Benchmark rigid pipelay performance by project, vessel, pipe specification and laying type
Monitor the OSV market and rig support activity
Track the global FPSO fleet and rig market for E&P planning and benchmarking

“Spinergie's Smart Fleet Management significantly reduced administrative burdens for SMT Shipping, streamlining regulatory reporting and providing a centralized platform for all operational and technical voyage details.”

Smiling man with short brown hair wearing a light blue collared shirt outdoors, blurred green background.
Joep Groot
Business Optimization & Projects, SMT Shipping
Four rounded square icons representing shipping and logistics: a crane lifting a load, an electrical plug and socket, a cargo ship, and a crane lifting a shipping container.

Extend your coverage across the wider maritime market

Beyond core offshore segments, track, analyze and forecast adjacent industries and projects

Dredging activity & fleet analysis
Tugs market coverage
Heavy lift cargo (HLC)
Ports & Marshalling activities

“Spinergie's Smart Fleet Management significantly reduced administrative burdens for SMT Shipping, streamlining regulatory reporting and providing a centralized platform for all operational and technical voyage details.”

Smiling man with short brown hair wearing a light blue collared shirt outdoors, blurred green background.
Joep Groot
Business Optimization & Projects, SMT Shipping

How Our Clients Succeed With Spinergie

"As a Cargo Operations Manager supporting BP Logistics, I use Spinergie every day for vessel tracking and vessel intelligence. In my opinion, it is the best product on the market.

The platform gives us the visibility and confidence needed to manage offshore vessel activity, especially as we continue to share vessels between operators. Spinergie has become an essential tool for tracking vessel movements, improving situational awareness, and supporting smarter logistics decisions."

Kurt Copeland
Cargo Operations Manager, Edison Chouest Offshore

"In a fast-moving market, our market intelligence must keep us ahead of the curve — and Spinergie delivers exactly that"

Maxime Toulotte
Markets & New Solutions Director, Nexans

“Spinergie tools help us understand competitor activities and where vessels are expected to be placed. This makes it significantly easier for us to plan our operations and make decisions backed by robust data analysis."

‍

Floriane Coudun
Commercial Business Analyst, Nexans

“Spinergie Market Intelligence enhances our forward-looking analysis by enabling us to better anticipate and predict the evolution of the offshore wind market.”

‍

Alex Blankenstijn
Senior Market Analyst, Jan de Nul

“Spinergie enables us to benchmark our project plans against the broader market, [and] we can more readily identify vessel opportunities to stay a step ahead of the tightening supply chain.”

‍

Oscar Diaz
Chief EPCI Officer, OceanWinds

Offshore Resources

CASE STUDY
Offshore
Market Intelligence

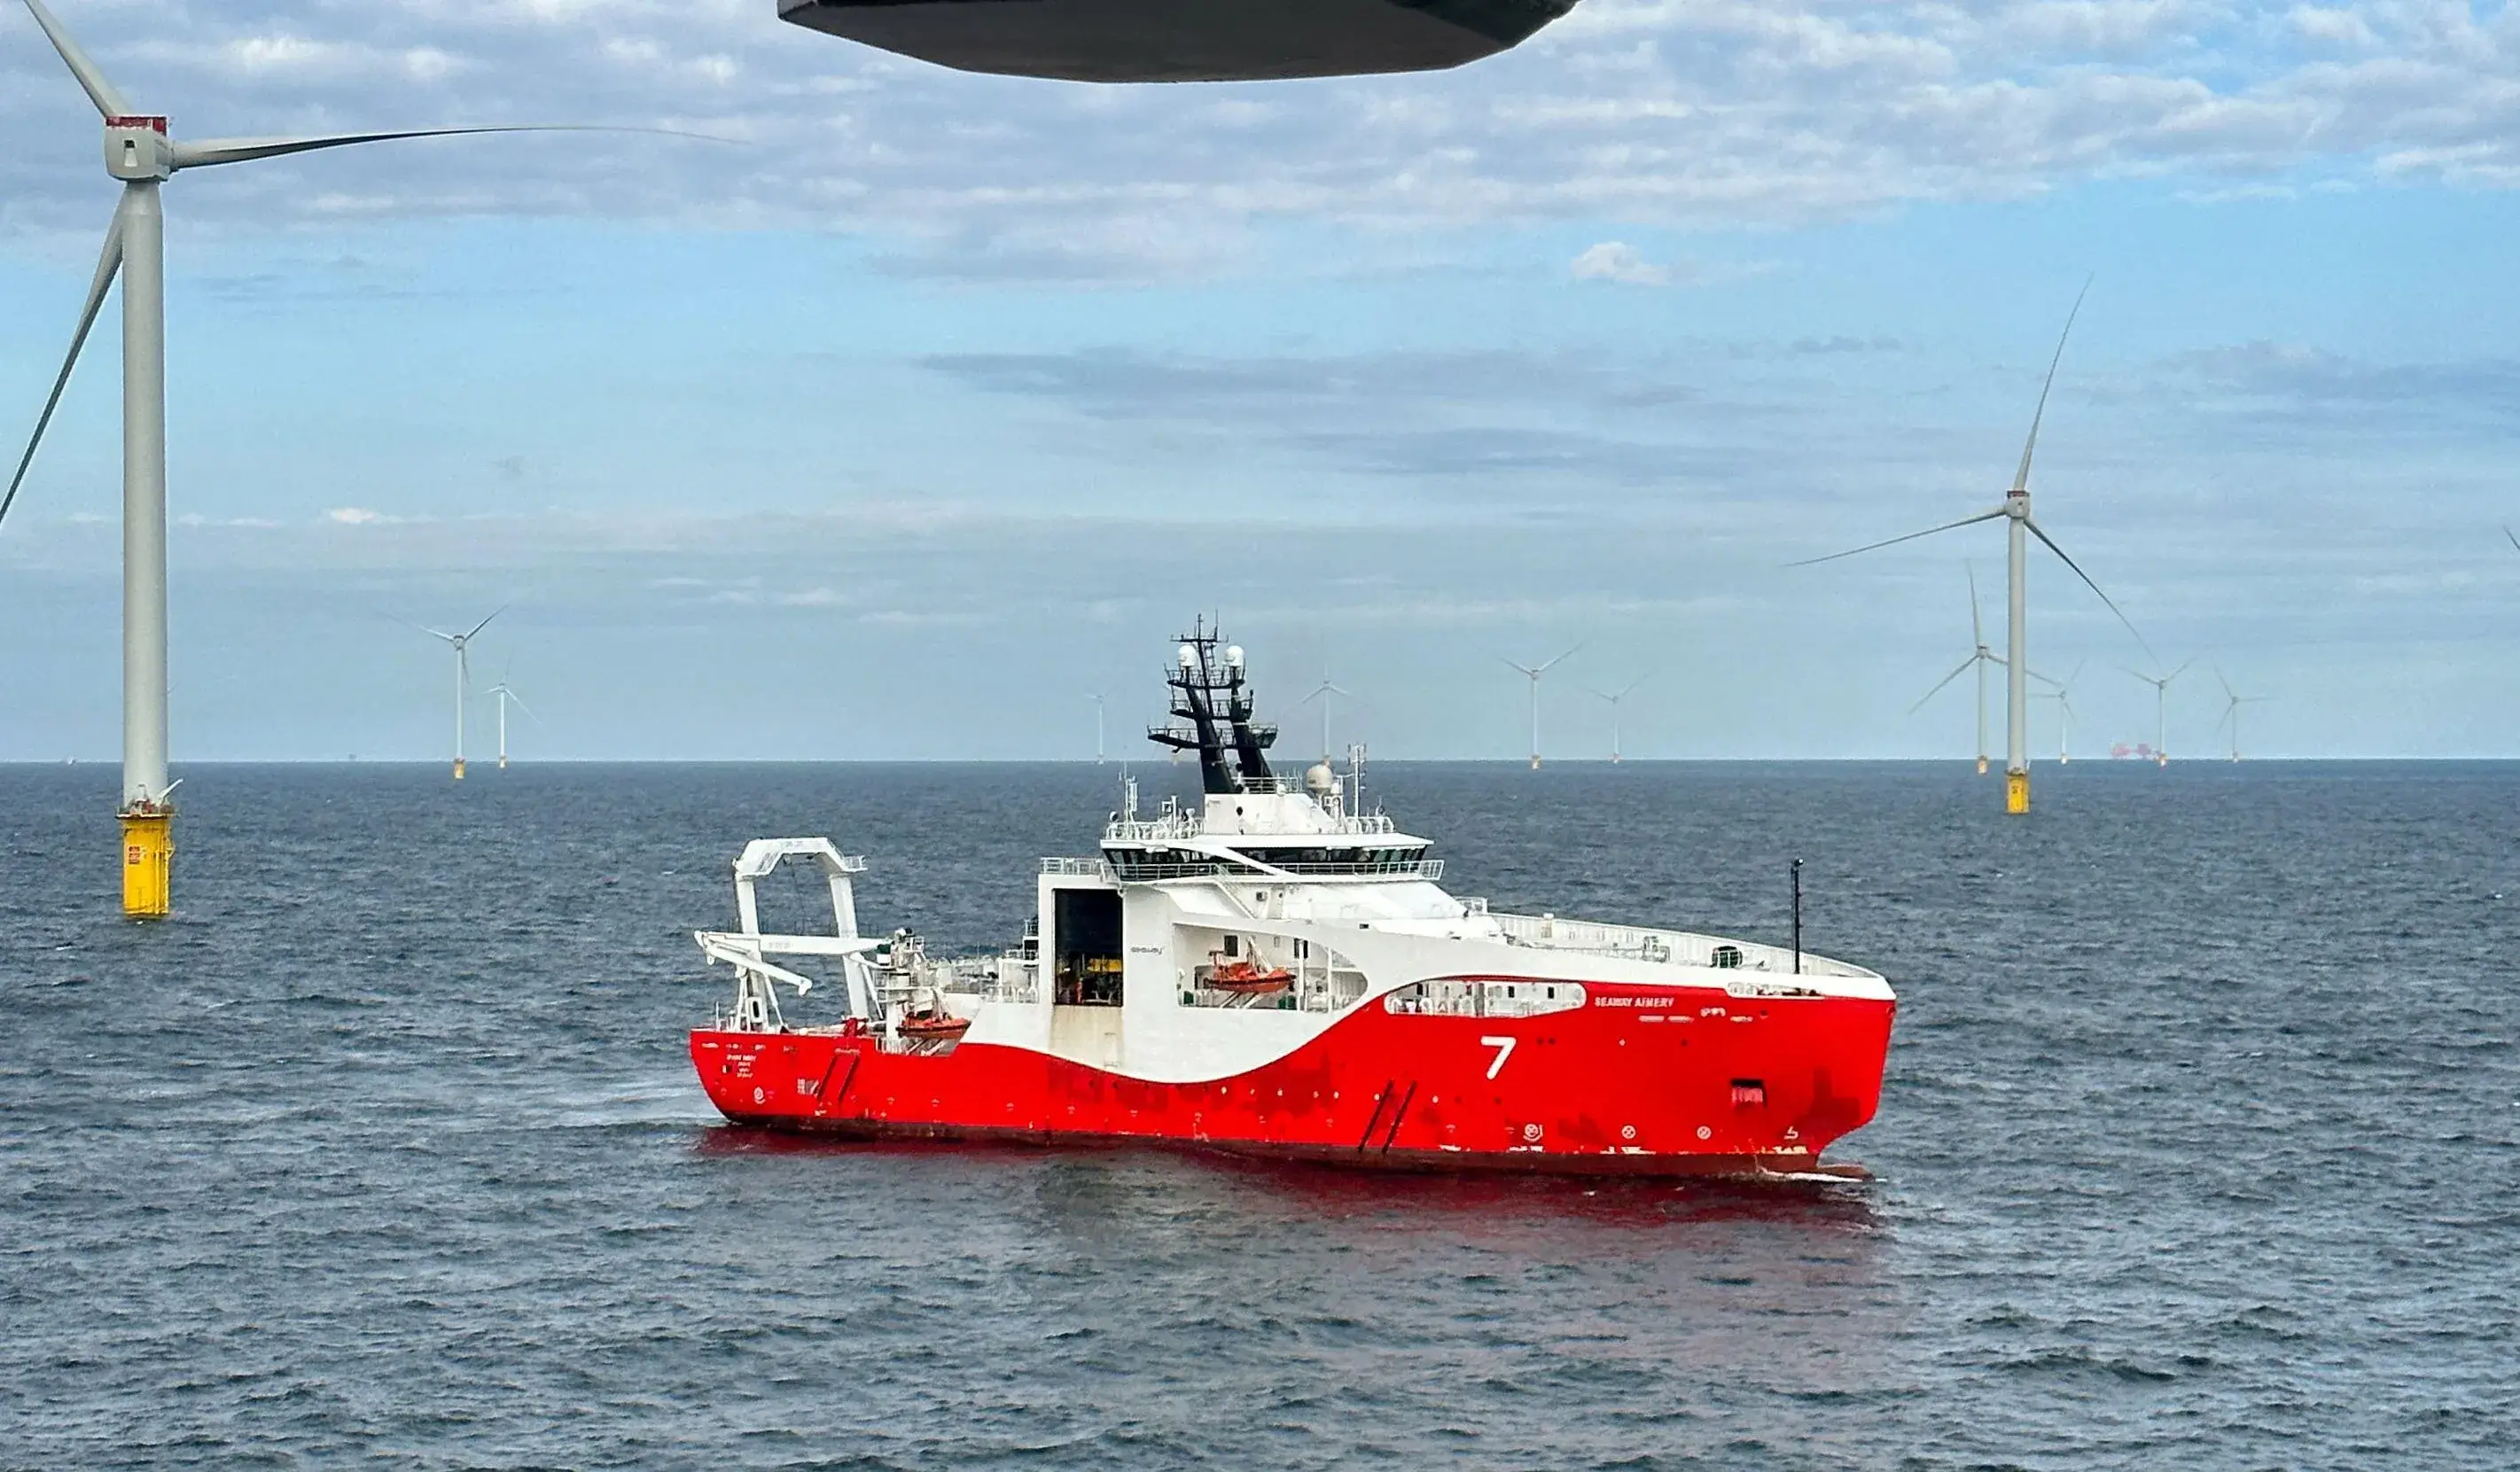
Boosting efficiency with API integration and specialist support (Jumbo)

How Jumbo has used Intelligence by Spinergie to integrate better market visibility into their workflow.

12/2/2026
CASE STUDY
Offshore
Market Intelligence

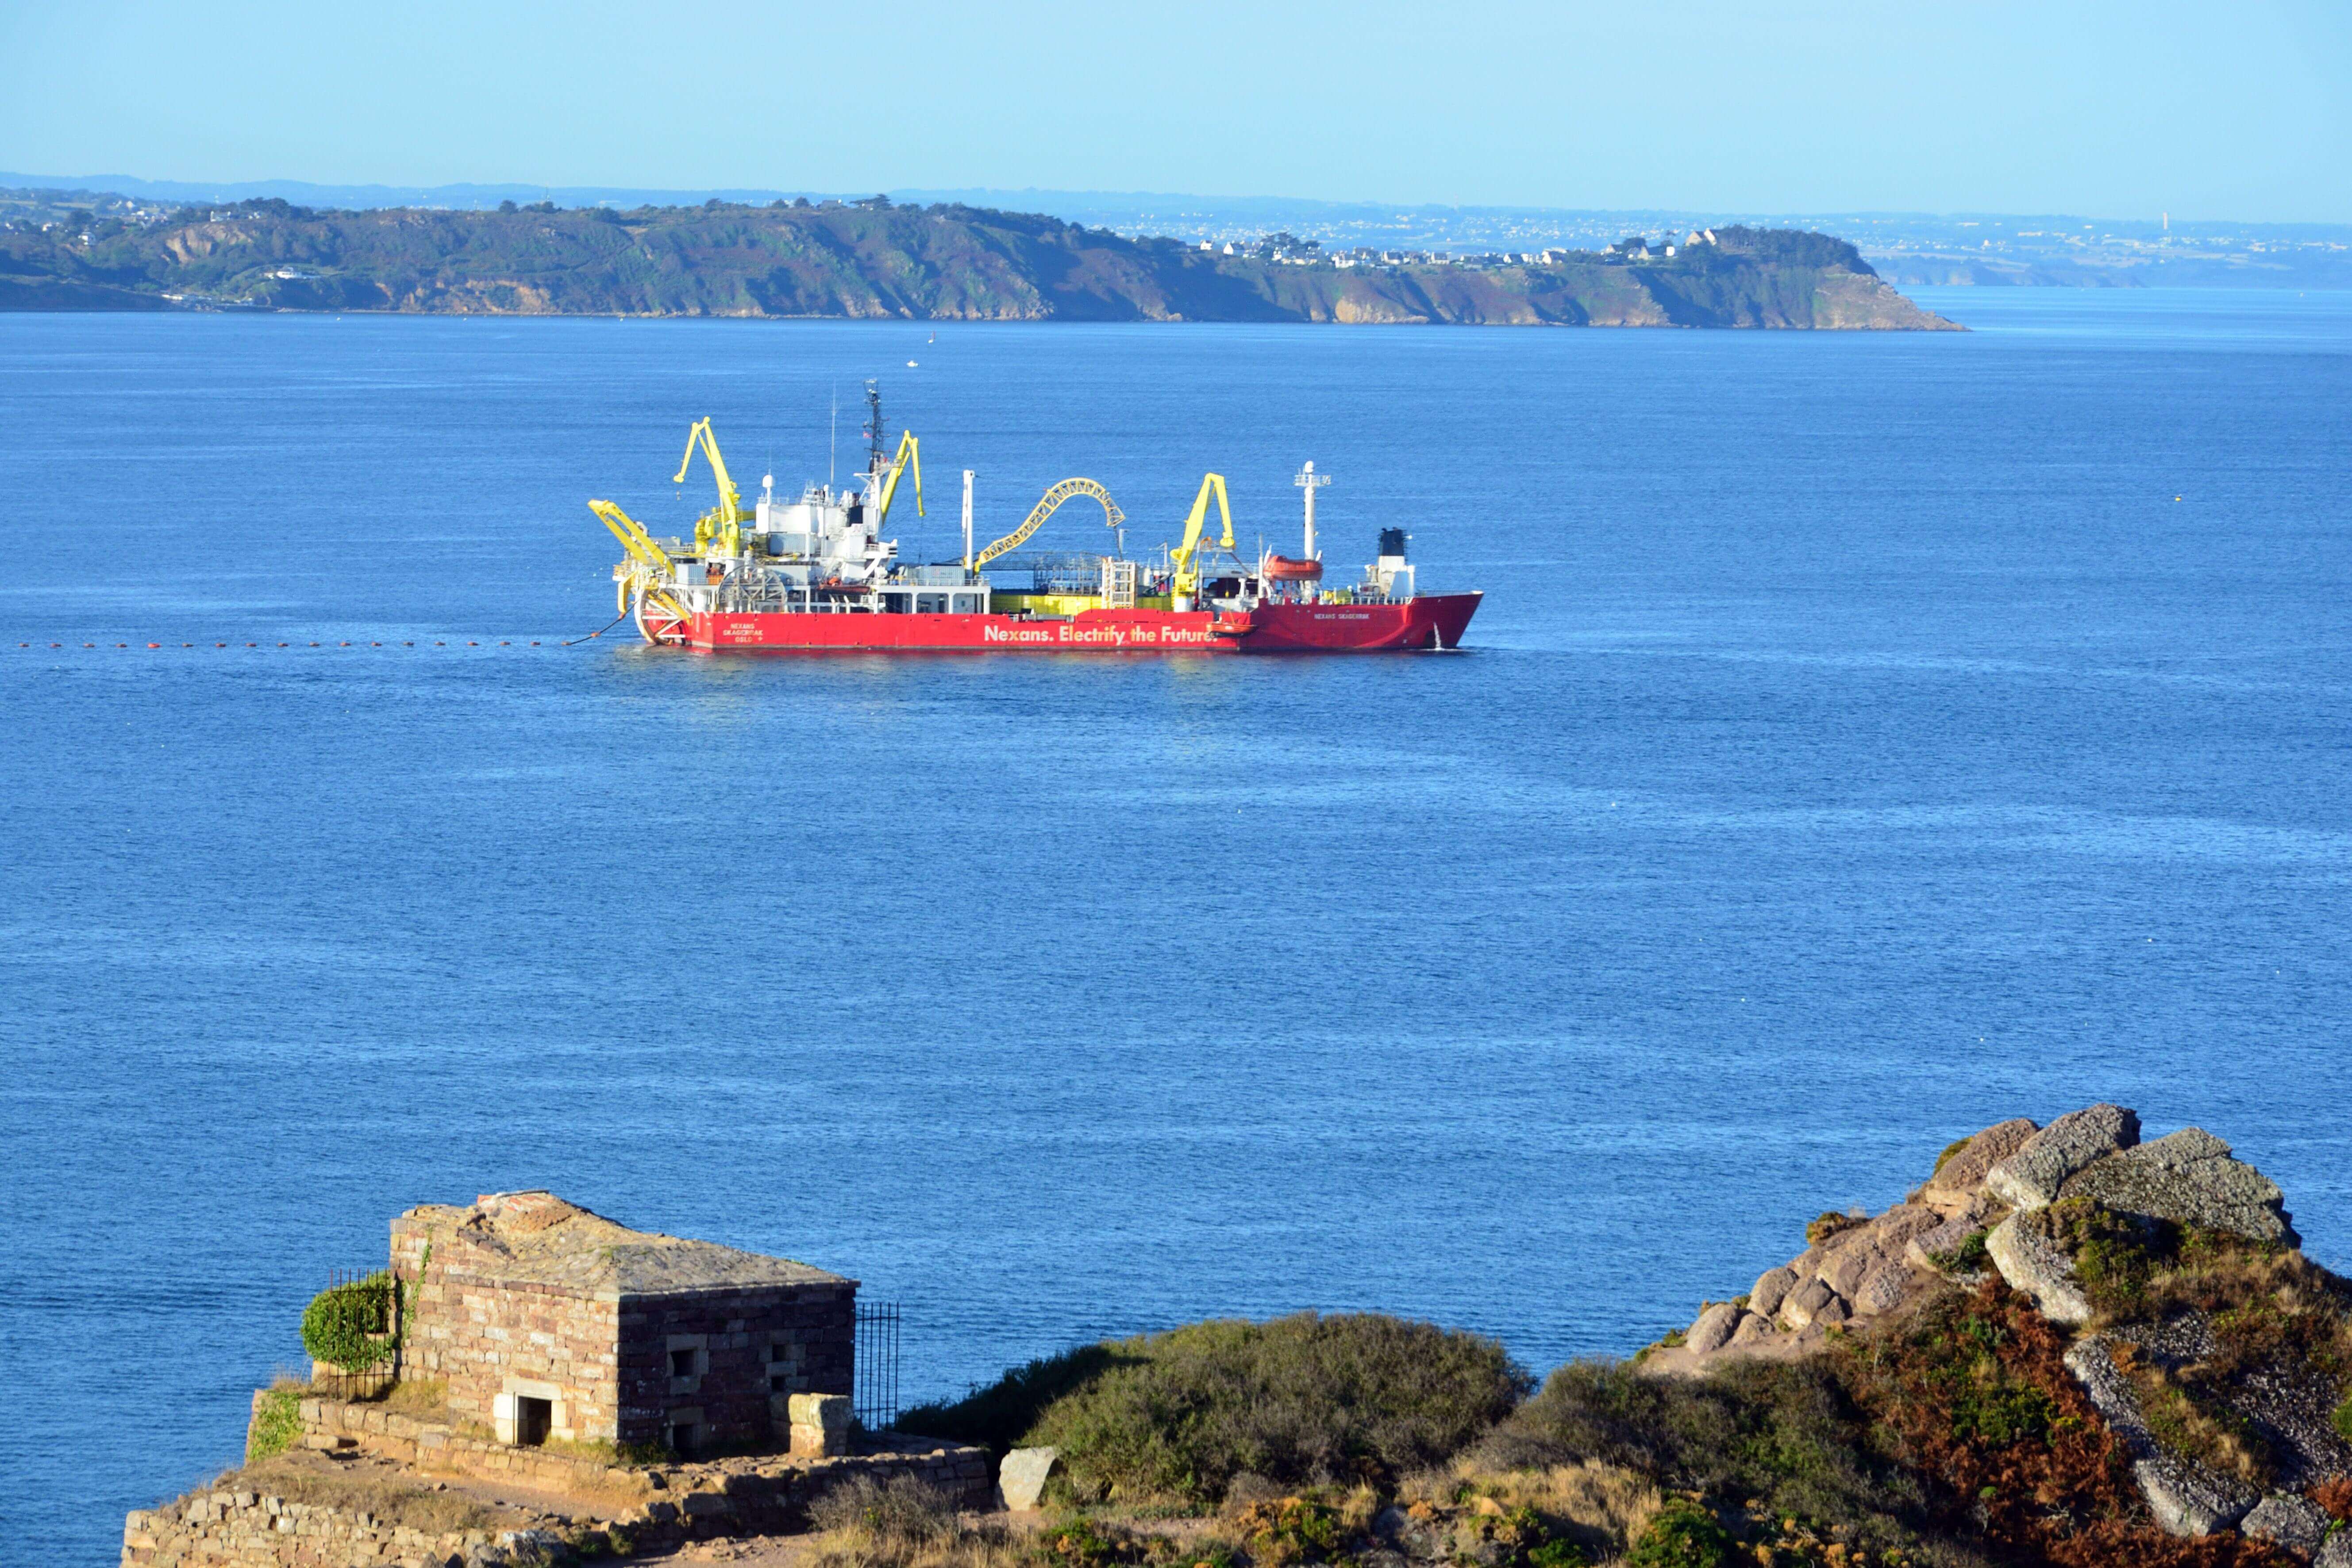
Accessing deeper insights into vessel and project activity (Nexans)

How Nexans use Intelligence by Spinergie to navigate growing offshore wind demand and a tight cable lay market.
30/1/2026
CASE STUDY
Offshore
Market Intelligence

Forecasting workscope durations and vessel suitability for an upcoming export cable lay project

How a wind developer used Intelligence by Spinergie to compile a shortlist of suitable CLVs for their upcoming export cable laying programme.

23/10/2024