
Port availability and capability is a key consideration for offshore wind developers. With demand increasing across the fixed and floating sectors, and the constant demands of the oil and gas sector, port capacity is at a premium. Finding a suitable port that both fits requirements and is available at the right time is a challenge all developers are facing.
Challenge
Offshore wind requirements are changing how port capacities are booked up, and developers need to ensure that port capacity will be available for upcoming projects much earlier in the planning stage. Capacity and capability are only part of the puzzle as using learnings from previous projects is also key to success. Common questions include:
- What facilities are close to manufacturing plants?
- What experience does this facility have as a marshalling port?
- Is this port used for any operations and maintenance activities?
By analysing previous scopes, the developer can compare and benchmark against their project criteria to ensure the correct facilities are selected.
Spinergie Market Intelligence
Identify suitable ports and quays for offshore wind projects
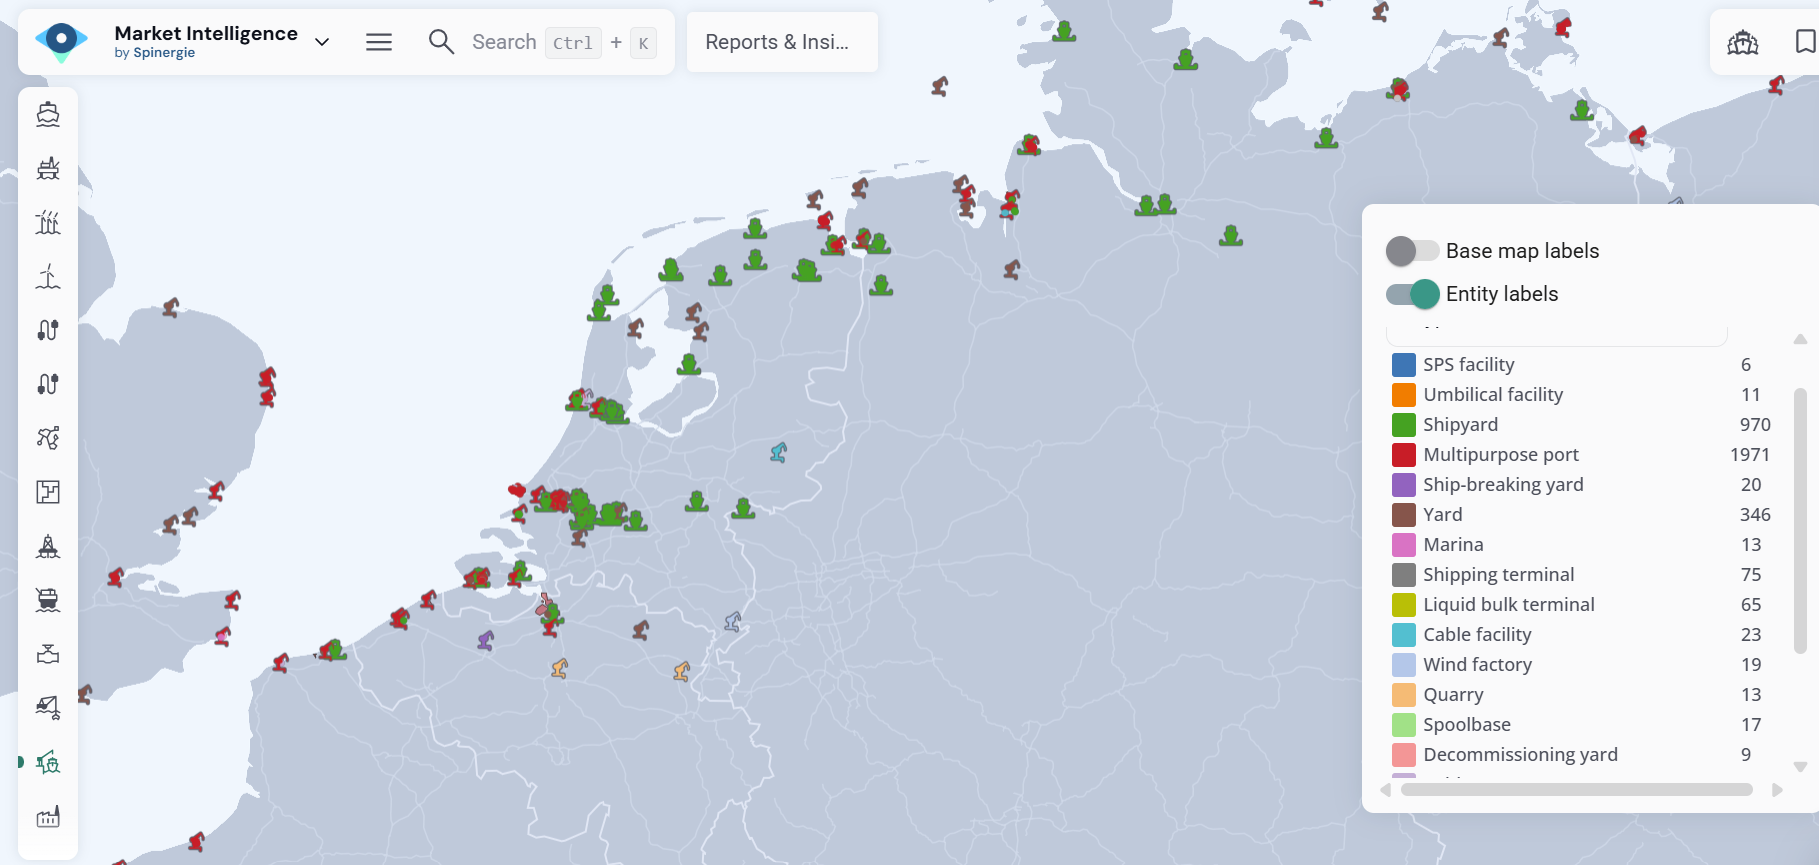
The Live Map shows the ports closest to a project location. Colour-coding indicates headline details about a port, whether it is multipurpose or more specialised—such as a cable facility or wind factory. Switching the legend changes the coding to show the port's status, making it clear which facilities are active and which are still in the planning stage.
The Ports and Quays map layer intersects with the Wind Farm layer to give a visual of the region, highlighting other wind farms that could potentially also be seeking to use these facilities in the future.
Tooltips provide a quick view of key technical specs and vital information about a selected port or quay. For active ports, users have immediate access details including draft and length of the quay, lifting capacities, and crane detailing. Any available specs, including the expected installation date, are shown for planned ports.
Many Spinergie clients use the initial map layer to compile a shortlist of facilities. This is made easier with advaced filtering for both ports and quays, enabling deeper technical selection before undertaking further analysis.
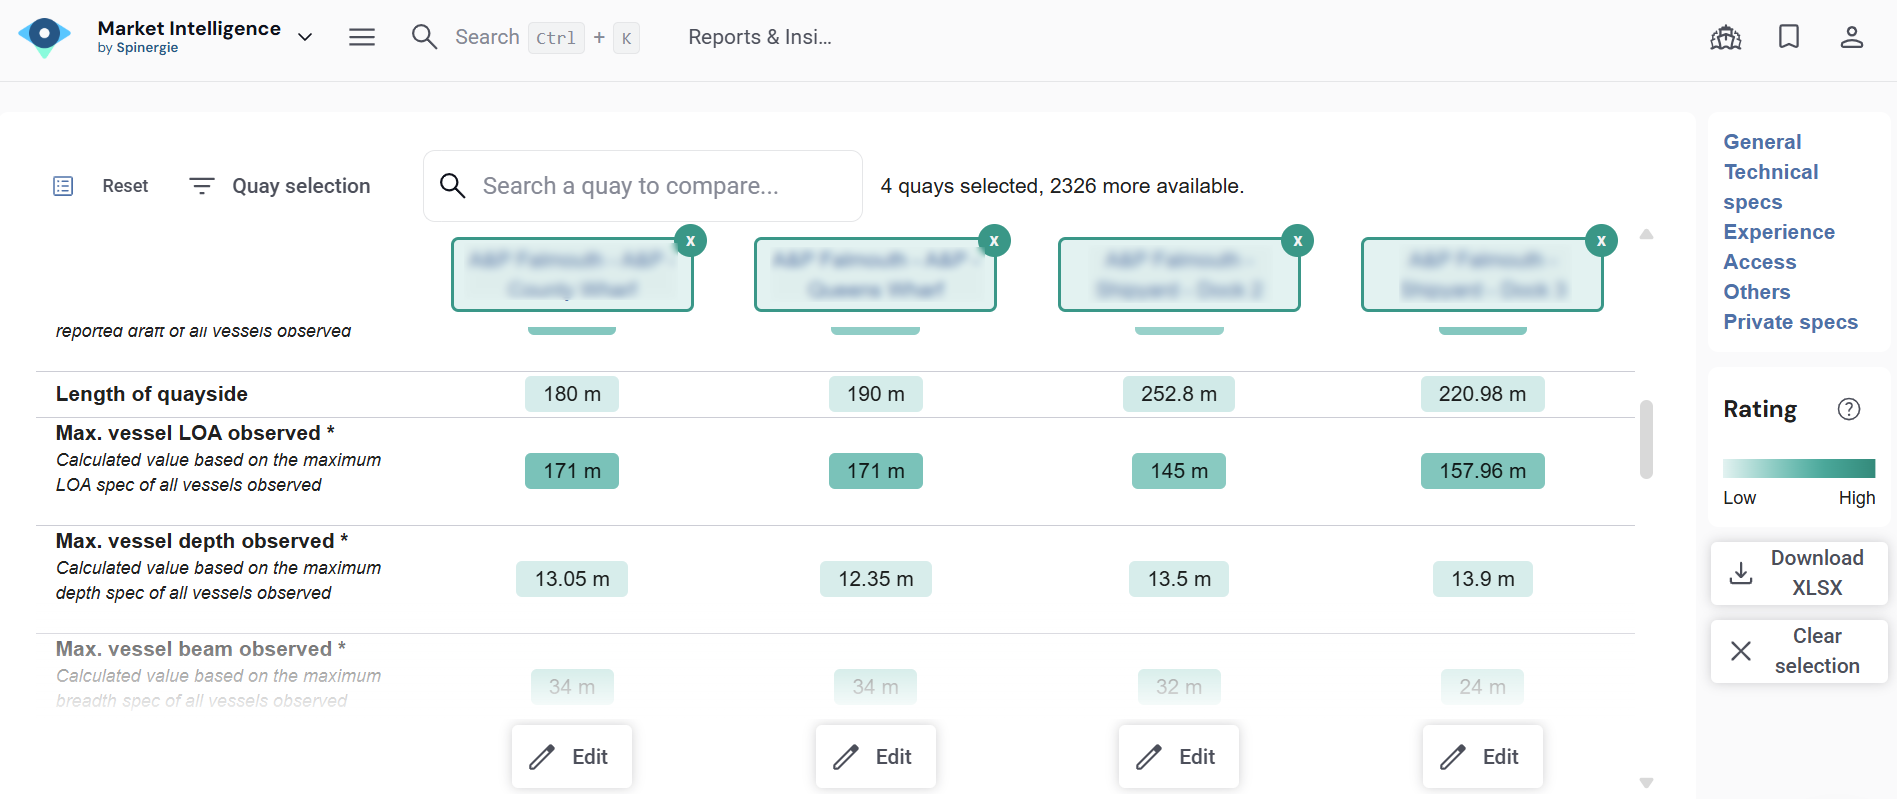
Benchmark and compare quay facilities
The Quay Comparator is where any number of facilities can be viewed side by side. Saturation-colour coding shows how high the facility's specification is at a glance. For example, if a user wants to understand the heavy-lift capabilities of aport, they could enter their project specifictions and view all suitabe quays side by side. This analysis can be used for turbines, foundations, or heavy operations and maintenance work.
Analysing previous activity at a port or quay
Scheduling is incorporated into the Ports and Quays module to show previous and current port activity. The Schedule provides insight into how ports and quays have been used in the past and for what work scopes. It can also be used to benchmark activities and timelines. Tooltips highlight additional project data and timings including scope duration, number of trips, and vessel specs.
Each port and quay has its own Fact Page which more in-depth specs and scheduling details. These pages also carry further analysis of draft, depth, length, width, and gross tonnage. Each spec has a dedicated chart, aggregating data from ~10 years of port activities and observations from thousands of vessels. This helps answer questions like how many vessels have used the facility for that draft, and what is the maximum vessel draft of the port. This gives real-time examples of specifications in practice, reassuring users that a facility has successfully handled previous scopes of a particular specification. Other metrics included in the Specifications Checker are depth, length, width, and gross tonnage.
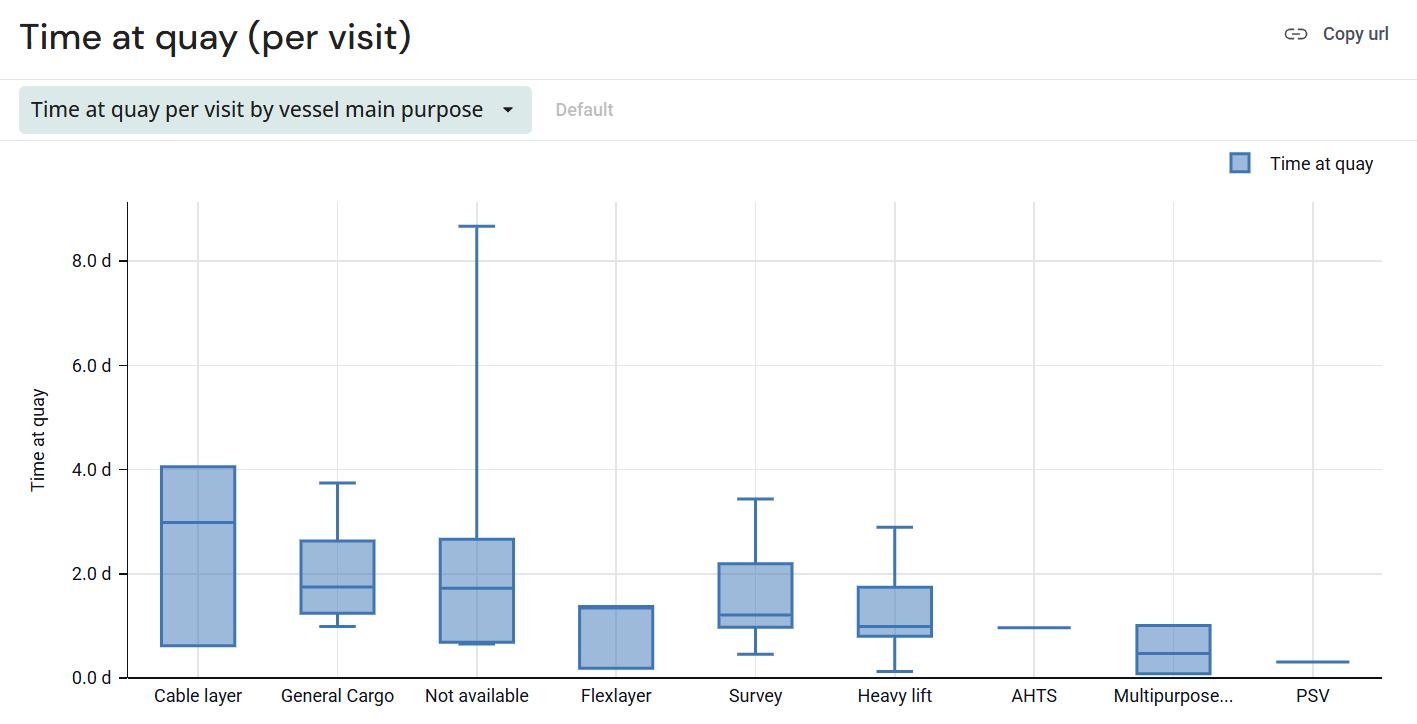
Further Fact Page analytics include an extensive weather library, vessel activity, time spent at quay per vessel, and tide tables.
Result
With a comprehensive analysis of port facilities users gain clarity on previous rexperience and performance. This helps them make the most informed decisions for their upcoming projects and ensure more efficient operations.
Contact us today to request a demo of the Ports and Quays dashboard and discover how it can help your team in planning your upcoming offshore projects.
Our team will show you exactly how we can adapt the solution to your needs.
.jpg)