Sarah McLean
,
Lead Content Manager
Author
, Published on
March 23, 2026
No items found.

Discover how Spinergie users can optimize KPI tracking using Smart Fleet Management’s Operations Performance Dashboard.

Tracking and collating Key Performance Indicators (KPIs) can be an intensely time-consuming task. Furthermore, navigating numerous intricate spreadsheets without standardization across multiple sources means such processes are time-consuming and prone to inconsistencies. This makes accurate analysis of the compiled data extremely challenging. Spinergie’s Smart Fleet Management (SFM) solution removes these pains from KPI tracking by compiling them into one user-friendly and intuitive page: Operations Performance.
Spinergie’s Smart Fleet Management is a suite of tools that maritime players can use separately and in tandem to track, monitor, and optimize their operations. The platform seamlessly combines all data sources into one agile, intuitive solution that eliminates the need for multiple easy-to-lose and difficult-to-keep-up-to-date spreadsheets.
Four main threads make up the SFM platform: Smart Reporting - which automatizes data processing and helps in compiling internal and external reports; and Vessel Performance and Voyage Optimization - which, in turn, aim to reduce fuel consumption by analyzing and understanding consumption drivers and modeling and optimizing speed while sailing. Finally, Operations Performance, the purpose of this article, helps operations managers and marine and logistics engineers ensure their operations are running at their best and enable them to react quickly to any arising issues.
Find out more about Smart Reporting and Operations Tracking in our use cases: How a shipowner uses Spinergie’s Smart Report solution to enable a cycle of continuous improvement and How Spinergie helped an operator synchronize its offshore supply fleet activities in West Africa.
The Operations Performance dashboard is fully customizable to your operational KPIs so you can monitor what matters to you. Our experienced team guides clients on the way to report and consolidate your KPIs so they can be effectively tracked and shared across your organization. All KPI variations benefit from the following elements.
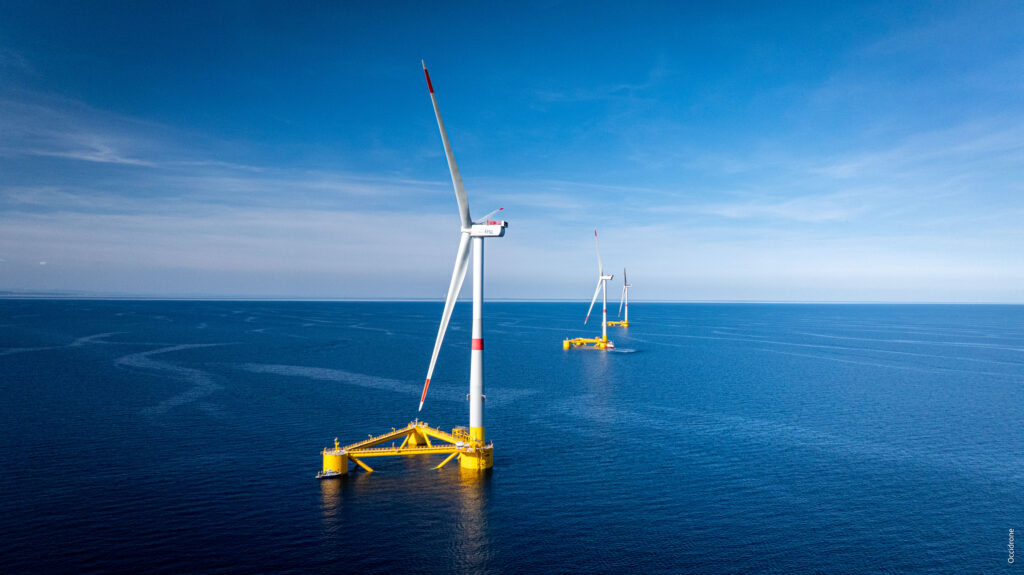
Imagine how much simpler it would be to access a project's performance metrics in one easy-to-use source. Take operations and maintenance in offshore wind as an example; a dashboard could be created to grant the developer an in-depth, accessible view of how all vessels perform, with all work scopes recorded and ready to view with one click.
Visual displays make it easy to see where a project is going well, what needs further attention, and, most importantly, why. Just one additional click brings users to the analytics page of the project, where contextual information is stored. Here, users come to understand what root causes are playing into lagging performance, whether it’s unexpected downtime due to weather or otherwise.

The Operations Performance dashboard can be utilized as a single-source collaboration within your organization. With all stakeholders having access to this standardized view of essential metrics, you can ensure all are aligned while making collaborative, data-driven decisions.
A simplified view makes review significantly easier and fosters a transparent relationship between stakeholders, as all teams can clearly see agreed performance metrics.
Users benefit from an intuitive interface that filters data by various metrics, allowing both parties to gain the key insights pertinent to their roles. Metrics will be tailored to the client’s needs, but an example of a KPI hierarchy could be to show vessel availability. Under that umbrella, additional metrics provide the context of what proportion of the fleet is working, what is on standby, what is affected by weather, and what is undertaking contractual maintenance.

Users can click on any KPI to view its trend over a chosen period, once again ensuring all stakeholders are aligned. With KPIs tailored to each client, there are many tracking possibilities. Additionally, recorded data is complemented with green or red arrows to indicate improving or declining performance. This means it is easy to see at a glance how the trend is turning for a specific vessel under a specific metric.
Some key uses for the solution could be to ensure contract terms are being met, that maintenance is being completed correctly across various sites, to provide a data backup for performance reviews, and to identify any areas of improvement.
Operations Performance can be viewed under several review periods: monthly, quarterly, or annually. This makes it significantly easier to accommodate different preferences and needs when compiling time-sensitive reports, making the process less time-consuming for your team.
All stakeholders can benchmark and identify areas of excellence or improvement. Compare data across any number of vessels in a fleet, or project elements, to understand what is going well and what could be improved. The ability to compare like with like, or apples with apples, makes it much easier to see exactly what elements are working and which need attention.

Access to the Operations Performance dashboard doesn’t mean your team needs to have eyes on it every second of the day. Alerts can be set up to monitor any of the KPI metrics and alert the relevant stakeholders whenever a threshold has been reached or if a metric requires immediate attention. These alerts empower onshore and onboard teams to change vessel behaviors or rectify poor performance proactively.

The Operations Performance dashboard is just one element of the solution that is helping to revolutionize how maritime players navigate analytics. Spinergie understands that KPIs are not a one-size-fits-all set of metrics but that tracking requires personalizing the fine details to ensure they are as relevant as possible to each client. Because of this, Smart Fleet Management users can rest assured of having a single source solution for the full duration of any project, no matter the timescale.