
Sarah McLean
,
Lead Content Manager
Author
, Published on
March 23, 2026
No items found.

Spinergie analysts have examined weather data at over 4,500 offshore installations across Europe since 2016, read on to discover some interesting findings and how they could impact the market.

A number of key insights into weather data at offshore installations have been uncovered by Spinergie analysts. The study involved the compilation of weather data, since 2016, from over 4,500 installations across Europe and from it, several interesting trends emerged.
Analysts conducted the study via three clear steps:
The analysis is based on individual campaigns which will include a unique vessel, undertaking a unique activity at a unique wind farm. The thresholds discussed here are determined at the campaign level, and can therefore change from one campaign to the next depending on individual geography, vessel equipment component sizes, etc.
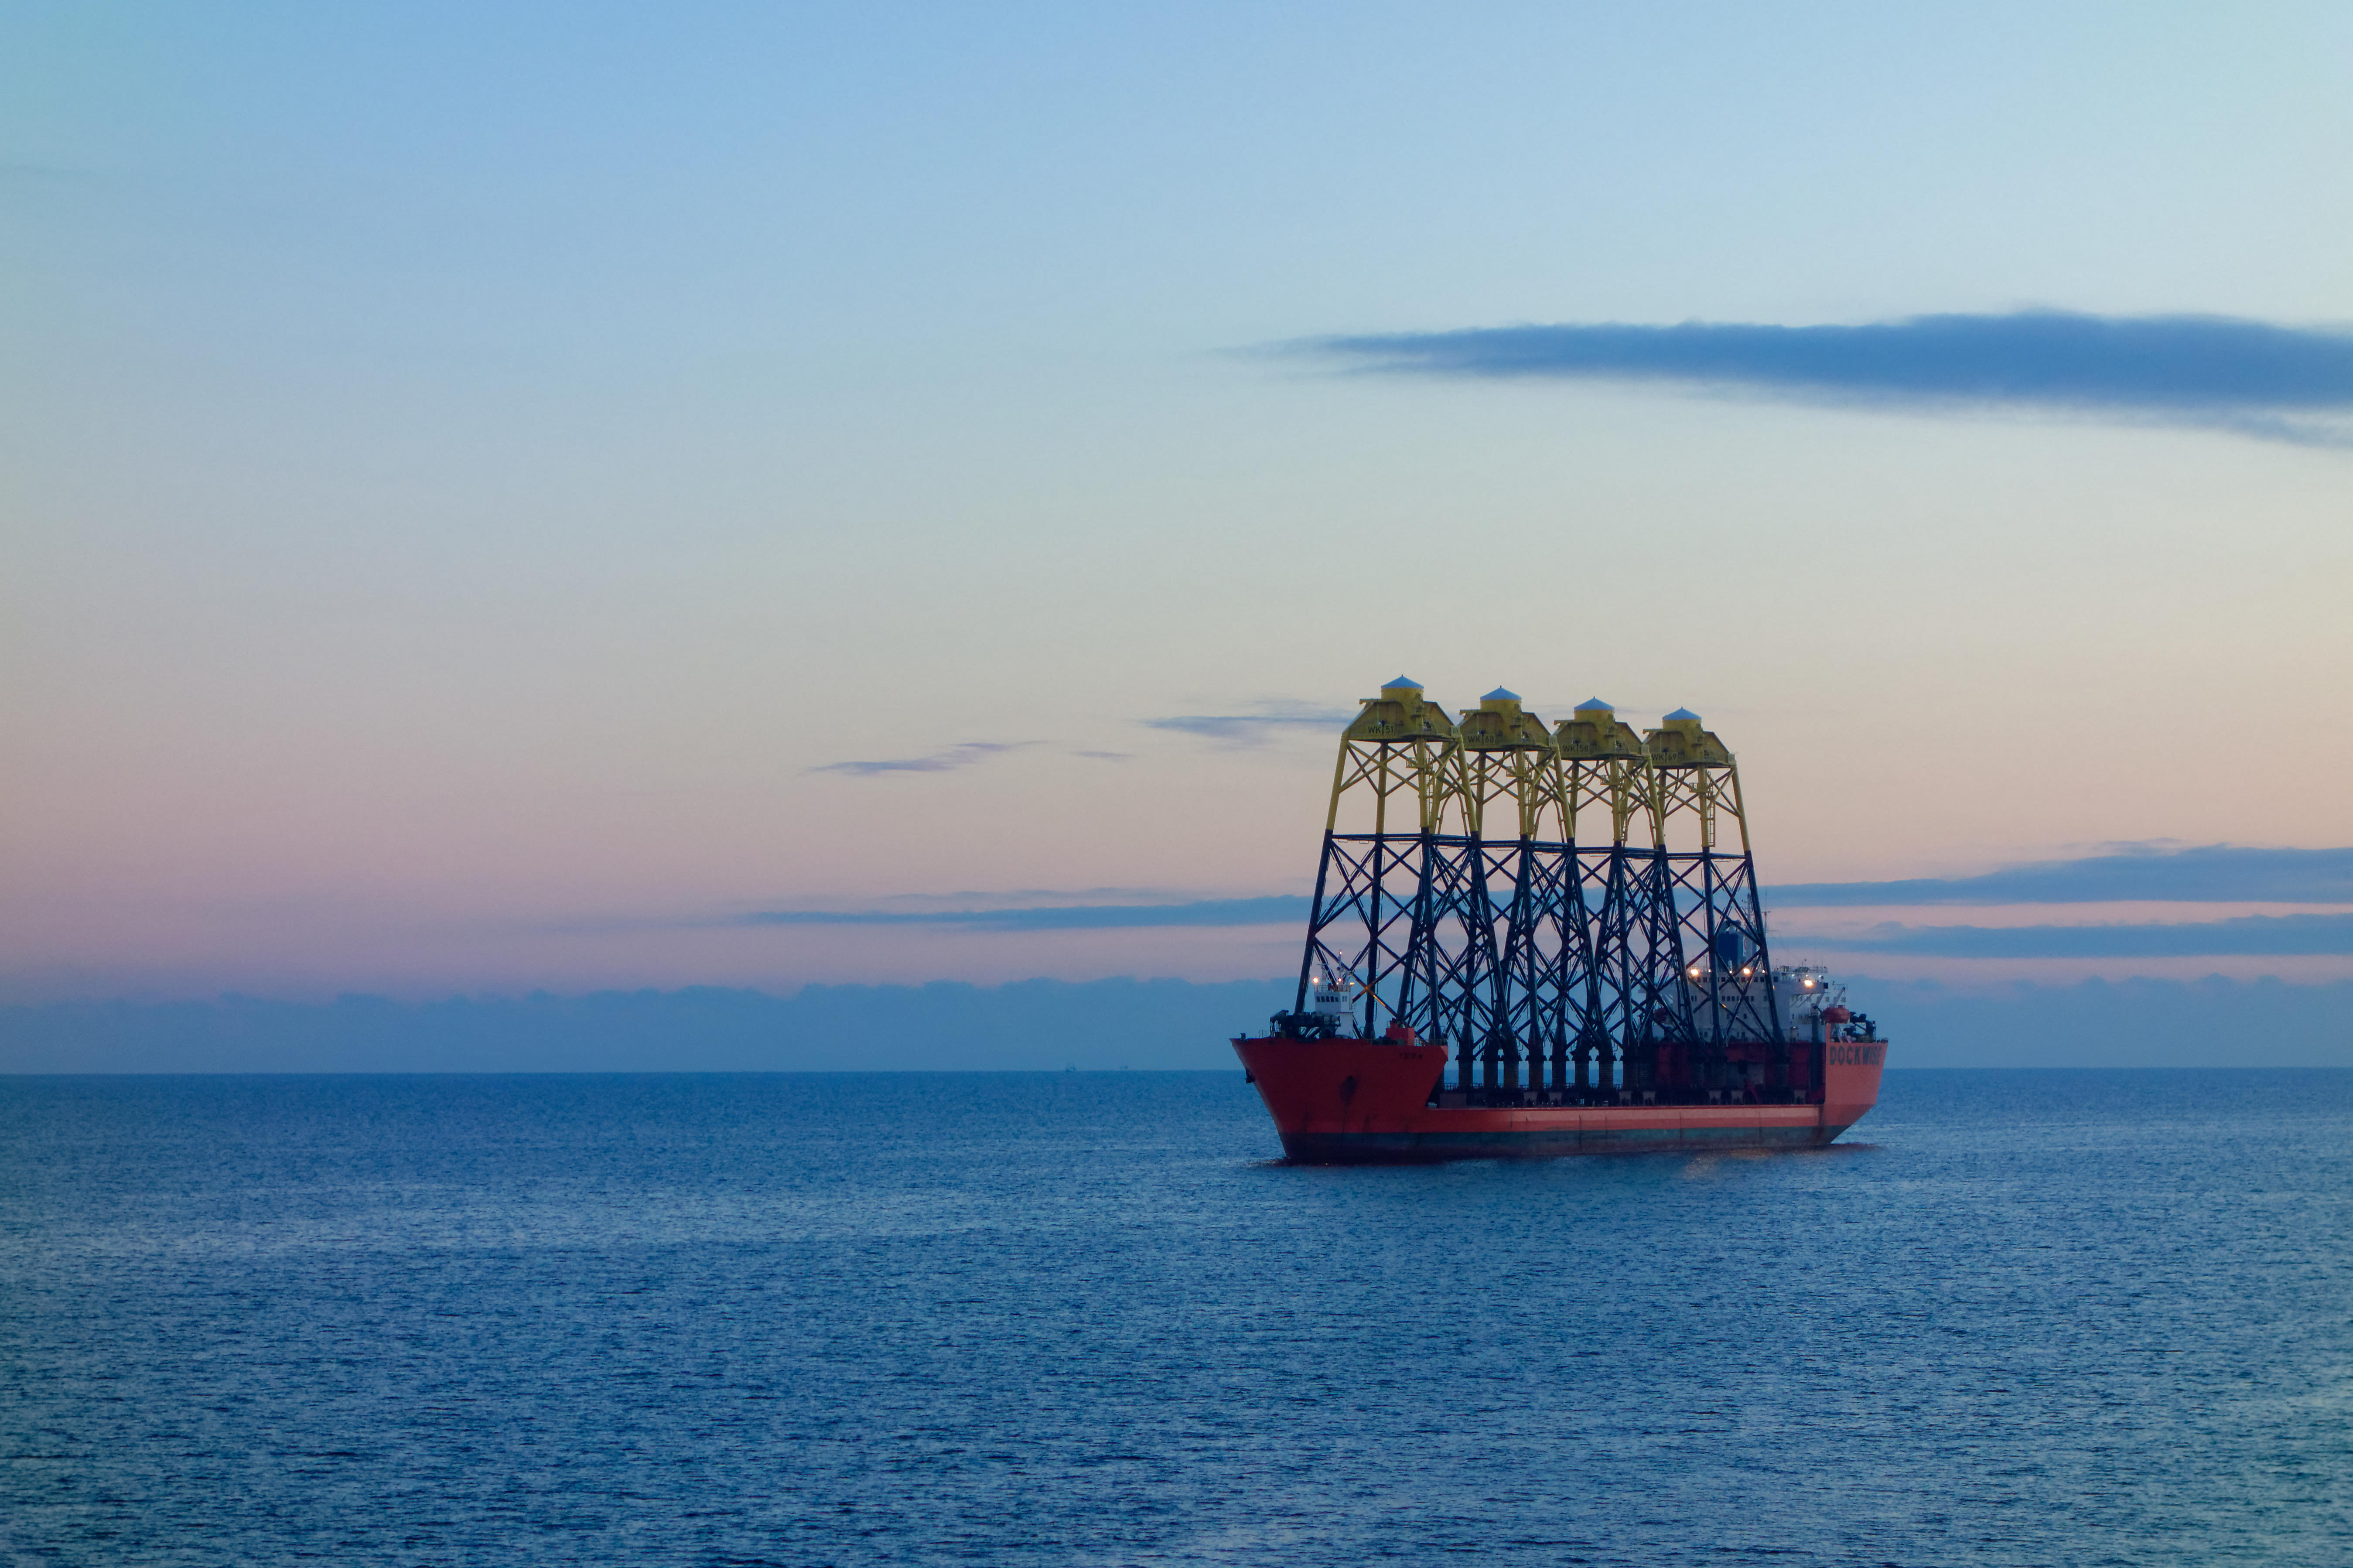
Through the study, a weather downtime threshold was established for both foundation and turbine installation activities. Beyond this threshold, there was a clear uptick in downtime for both activities. The following example highlights the wind and wave thresholds for foundation installations. The wind threshold (100m) is 11.5 m/s as shown on the x-axis while the wave threshold of 1,059 m is shown on the y-axis. The red markers represent increased downtime showing the clear adverse impact high wind speeds and wave heights have on installation performance.

In further analysis, it is important to note that a learning curve is present in each installation campaign therefore, Spinergie’s modeling takes this into account as determining technical downtime is only possible when a campaign is at an advanced stage with only the final 90% of installations included in downtime calculations. From here it is possible to see the average duration of installation at a project, technical downtime and suspected weather downtime.
It will come as no surprise that the summer months are the most popular for installation activities - particularly in harsh environments such as the North Sea - and those months saw the least instances of offshore downtime.
What Spinergie's analysis uncovered, however, was more notable. As depicted in the graphic below, it is clear that downtimes on turbine installations were significantly less seasonal than during foundation installations. This is mainly due to turbines being less impacted by wave height due to the use of jackup vessels while floating foundation installation vessels can be slowed down by high waves.
Spinergie offshore wind analyst Yvan Gelbart explained further, saying: “Piling installations performed in August over the last six years bottomed at 9.2% of offshore weather downtime compared to installations in January. In January, downtime reached 20.5%, more than two times higher.”
For turbines, downtime was at its highest (15.4%) during the winter, but the lowest was only marginally less (12.5%) during the summer.
While this modelling and analysis remain at a conceptual level, for now, the usefulness of the data is apparent. The analysis of weather downtime is increasing in importance as wind installation activity picks up globally. With supply chain issues at the forefront of many developers' minds as they plan projects it is vital to be able to determine optimal timelines and measure the impact of adverse weather conditions on previous installation campaigns to allow for comparison exercises.
As more data becomes available through increased activity, these further data points will enable more accurate modeling as time goes on.
To find out more about this topic, and how Spinergie’s Market Intelligence solution can help you make informed decisions for your upcoming projects, contact us for a demo today.
.png)