Context
The client wanted to digitalize its transshipment operations in West Africa to gain actionable insights, improve visibility on day-to-day operations, optimise fuel consumption and avoid demurrage. Additionally, the client needed help centralising operational documentation (Daily Reports, Statement of Facts, etc.) across the entire fleet.
Challenge
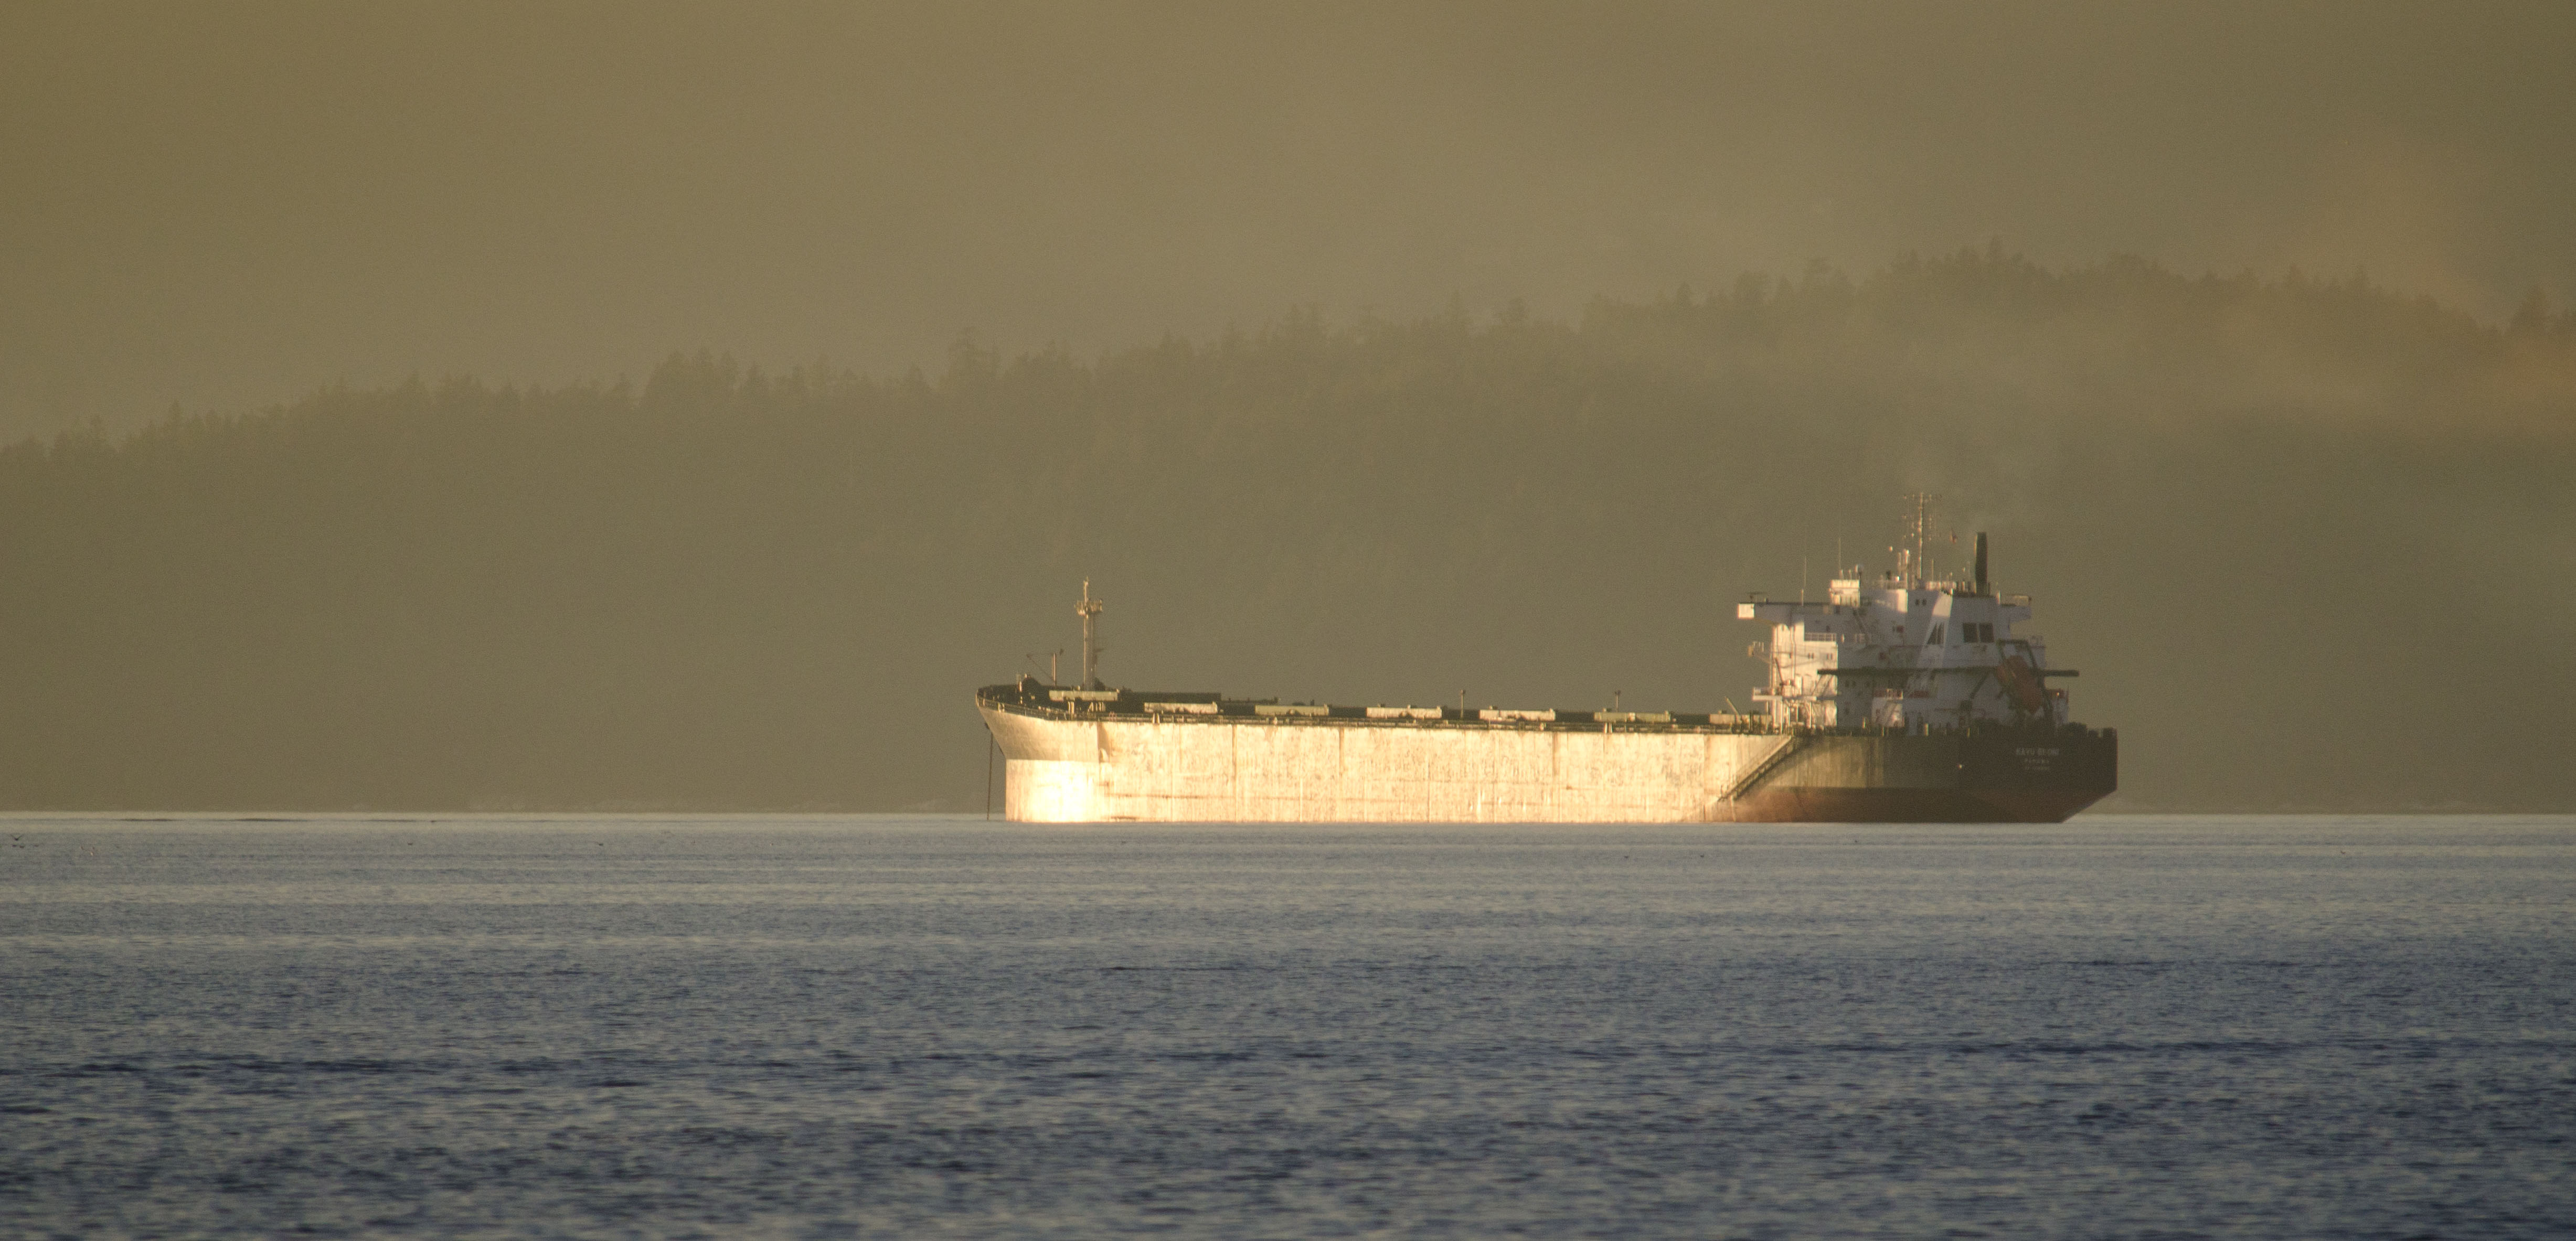
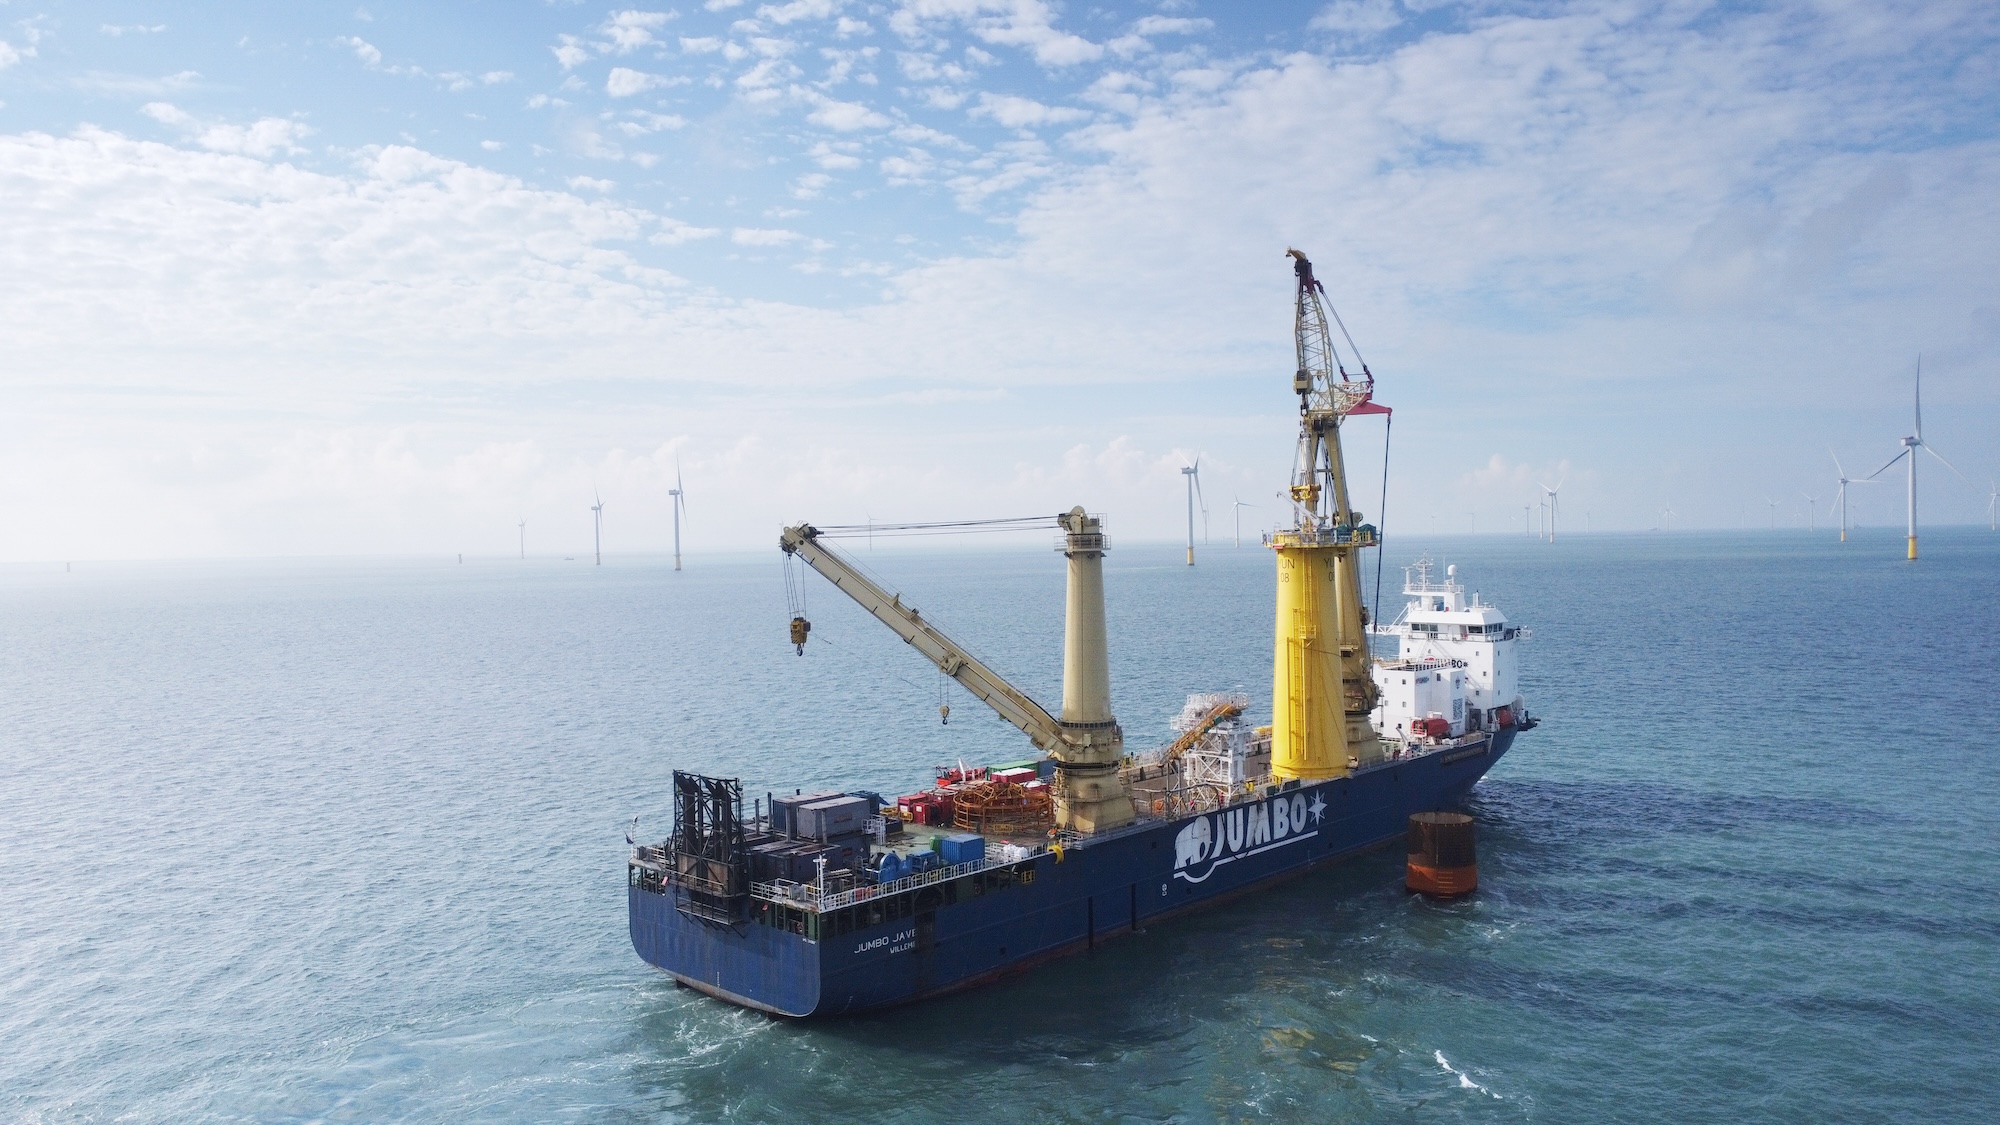
The client manages transshipping operations in West Africa. This largely involves exporting dry bulk from a shallow water port to an Ocean Going Vessel (OGV). To achieve this, the client uses two Floating Crane Transshipper Units (FCTUs) and four barges to load the Bulk from the ports and transport it to the OGV, where the Bulk is finally unloaded. The barges require several trips (cycles) to fully load up the OGV.
Lack of live actionable data: The client had limited access to live data from these transshipping cycles and activities. Lack of data limited their ability to improve operations and efficiency. It also resulted in lack of coordination between vessels and ports, leading to avoidable waiting times for vessels.
Fuel Consumption: Lack of sufficient data meant the client was unable to identify the least fuel-efficient activities and blocked them from making improvements. The client was also unable to understand the impact of emission-related vessel upgrades.
Decentralised documentation (Statement of Facts, Daily Reports, …) caused confusion due to multiple Excel files that were not always up-to-date and resulted in time-consuming data aggregation.
Statement of Facts (SoF) documentation records all cargo handling operations from the ship’s arrival at a point through the duration of operations and, finally, departure. By providing a consolidated and accurate record, the SoF facilitates agreement among parties on demurrage, laytime, and cost allocation calculations.
Spinergie Smart Fleet Management
SFM is built to track, coordinate and optimize offshore operations. SFM relies on a combination of algorithmic interpretation of vessels’ AIS signal in relation to geo-fenced locations, as well as vessel data such as Daily Reports (DRs) and sensor data.
Live Operations tracking
Vessel Automatic Identification System (AIS) data is embedded on an interactive map dashboard displaying relevant geo-fenced data (e.g., port, channel, operations and mooring areas, etc.). This enables users to get live updates of vessel positions, enriched with both DR and onboard & offshore sensor data—without making phone or VHF calls.
The client can also configure custom alerts to be instantly notified upon the occurrence of any event or vessel activity (vessel leaving site, high fuel consumption, or intrusion of foreign vessels, etc.). This enables stakeholders to take reactive decisions when operations are not performing as expected and, in the end, reduce delays & demurrage.
Digital DRs
Digital Daily Reports (DRs) are designed to help vessel managers standardize and centralize operational data. The user accesses a pre-designed form where user input is guided through automatic field population, error warnings and data quality checks. This significantly increases reporting consistency, while reducing manual reporting hours.
Track Key Performance Indicators for performance optimisation
Data collected from vessel AIS, digital DRs, fuel sensors, and weather parameters is compiled together to generate key performance indicators. These performance indicators include:
A. Transshipping and Load Rate analysis
Load rate from port and transshipping rate onto OGV can be analysed over time. This helps to measure improvement in operational efficiency.
B. Dive deeper into delays and stoppage
DRs can be analyzed to better understand and reduce the most commonly observed causes for delays. This helps stakeholders identify possible areas of improvement to achieve better operational efficiency.
C. Consumption Analysis
Fuel sensor data is analyzed into a dynamic dashboard, helping the client gain an understanding of the fuel consumption trends for their operations.
Advanced environmental KPIs
Using state-of-the-art modelling and development, SFM offers two major tools that can help vessel managers
- Calculate Carbon Intensity Indicator (CII) for any fleet: Adapted from work done by IMO and IMCA, and developed together with some leading vessel managers in the world, Spinergie's CII goes further in assessing carbon intensity by accounting for each vessel's activities and specs.
- Model and forecast fuel consumption and emission behaviour: This will help managers take proactive action by forecasting any vessel's emissions across different scenarios, understanding the impact of upgrades and more.
Result
Thanks to the digitalisation of the DRs, AIS positions, fuel sensors, and the compilation of data, the client was able to gain actionable insights into its transshipment operations. A deep dive into the common causes for delays helped the client take decisive measures and resulted in significantly reduced demurrage costs.
Availability of all the information and metrics live online helped the stakeholders save time on daily calls. Digital DRs improved the consistency of data coming in while saving the Captain's time, and delivering post-processing analytics and operational documents (such as SoFs). Visibility into fuel consumption data and trends has helped the client understand the impact of vessel upgrades and plan investment into new ones.

Our team will show you exactly how we can adapt the solution to your needs.
.jpg)