

.webp)
Achieving synergy in offshore wind operations and maintenance (O&M) is one of the most challenging tasks developers face, not least when multiple projects, vessels, and time zones must be accommodated.
Yet, by using Spinergie’s Smart Fleet Management (SFM) solution, our clients achieve the harmonization they need for improved reporting, communication, and planning. This case study details how one client used the reporting and analysis tools within SFM to stay on budget, save crew time, and improve O&M performance.
Context
Spinergie’s client is a global wind developer with commissioned and upcoming projects across both mature and emerging markets. Managing numerous vessels, regions, and time zones, the company needed a digital solution to centralize and streamline its operations.
Challenge
To ensure a wind farm's optimum availability and functionality, O&M operations see technicians undertake regular visits to each turbine and foundation for preventative and reactive maintenance.
In O&M, site visits are set in “man-hours,” with teams delivering a set number each month. Visits must be fulfilled within a financial and emission budget, most of which is absorbed by vessels and helicopters. Optimization is crucial to secure the correct number of man-hours per turbine. This ensures that maintenance is delivered and production continues unhindered. Furthermore, optimization is key to avoiding logistic inefficiencies, which result in unplanned and expensive costs.
The developer’s O&M managers deal with multiple vessel managers, vessel types, and activities with distinct requirements. Despite the complexities of the operations, reporting was previously completed via standard spreadsheets that were manually sent out daily. This was time-consuming and led to extensive data-checking procedures. Furthermore, managers were relatively isolated from other teams, leading to reduced communication and heightened risk of delays and, thus, higher costs.
Without centralized data gathering and synchronization, the O&M managers had limited access to the data they needed to make informed decisions.
The essential requirements:
- Be adaptable to operations in different countries.
- Encompass the needs for varying rules and regulations for each country.
- Adapt to local time zones.
- Be suitable for various vessels, from CTVs to diving, survey, JUVs, and SOVs.
- Harmonize the reporting process and introduce a standardized O&M reporting procedure.
- Provide a user-friendly reporting process with selected automation, guided entry, and data quality checks at the source.
- Be quickly adopted by all vessels and crews.
- Effortlessly capture the correct data for customized key performance indicators (KPIs).
Spinergie’s SFM solution
Spinergie’s SFM solution transforms a manual, fragmented reporting process into a centralized, data-driven system. There are some initial steps for all new clients:
- All existing data sources are mapped, including onboard sensors (fuel, emissions, engines), AIS/GPS tracking, POIs in operational areas, and weather.
- These sources are then plugged and processed within the SFM platform to serve as a single source of truth.
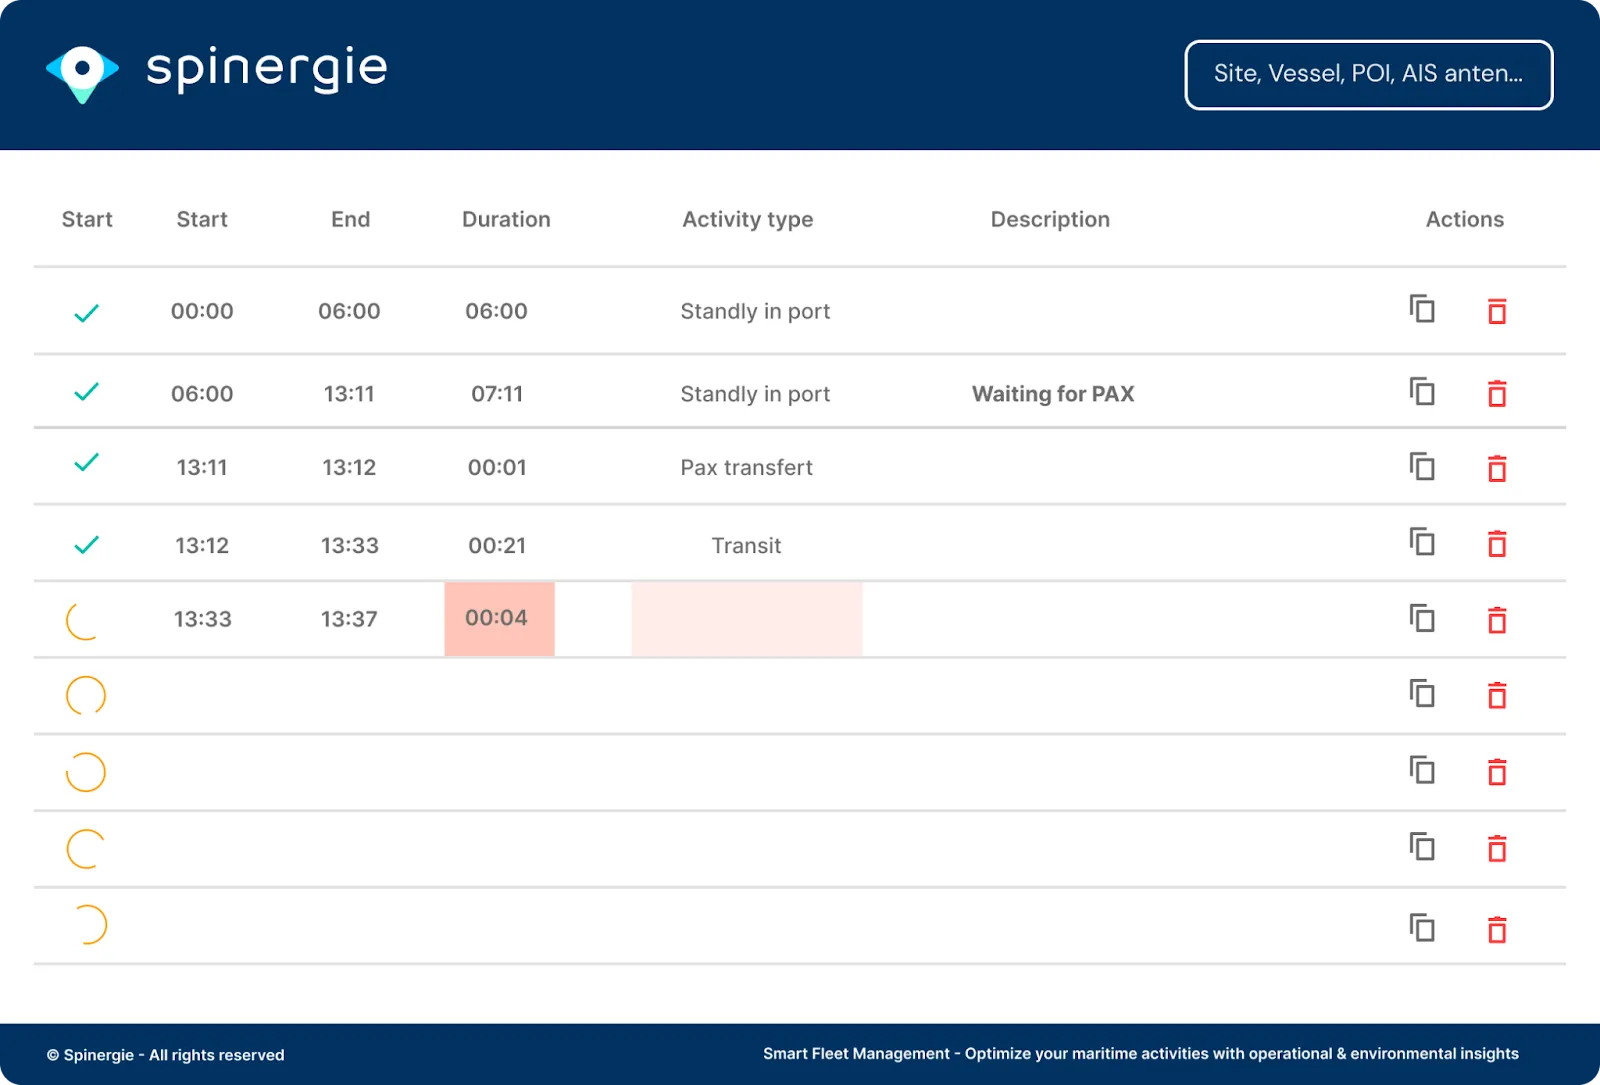
Digitalized Smart Reporting
Smart Reporting is at the heart of the developer’s SFM solution. The single-entry, guided interface reduces crews' time on reporting tasks by up to 90%, while multiple customized reports can be generated and sent to the relevant stakeholders. As an additional time saver, several integrated machine learning algorithms automate customer-selected fields, populating them automatically using the mapped data sources.
Error checks are built into the solution at the source of entry. For further security, all data points can be traced back to their source and are accessible to the relevant stakeholders across the organization. This ensures data quality and reduces the need for tedious and complicated rework later on.
Eased communication between all parties was a central pain point for the developer, and Smart Reporting has facilitated this while enhancing performance monitoring and tracking. Completed reports are easy to find within the solution via document tracking and analysis dashboards.
With standardized procedures and simplified data entry, the developer’s O&M reporting is now uniform across the fleet, allowing for accurate benchmarking. Consolidating data from all sources and operations helps managers optimize fleet composition and man-hours per turbine.
Analytics and Insights
The developer has several analytics and insights dashboards available within the solution.
Reporting Analytics dashboards cover three metrics: activities, time, and consumption.
- Activities are tailored to O&M operations and include indicators such as connections, the number of lifts, instances of transit or transfer aborted, or the quantity consumed.
- The time module analyzes activity durations for standby, waiting on weather, bunkering, maintenance, and other client-selected metrics. This highlights performance markers across vessels, projects, and wind farms (among other criteria).
- Reported consumption provides aggregated and trend analysis across selected metrics with a database of granular data points.
Furthermore, bespoke vessel analysis includes real-time tracking via a live map, utilization, and scheduling modules. These provide an at-a-glance view of under-or-over-utilization, allowing for immediate schedule readjustments to reduce downtime.
By tracking the frequency and duration of O&M activities, the developer can pinpoint any emerging bottlenecks and identify areas of inefficiency. By monitoring consumption patterns, the developerhas the data to optimize resource allocation.
The Operations Performance (OP) dashboard is fully customized to the developer’s unique key performance indicators (KPIs). It tracks and consolidates these KPIs to be easily tracked and shared across the organization.
Operations Performance is used for three key areas:
- Root-cause analysis: The first tier of the dashboard indicates which projects or vessels are working well and which need further attention. The ‘why’ is found within a deeper analytics dashboard that unearths the root causes of lagging or improving performance.
- An internal communication tool: With a standardized view of essential metrics, there is increased transparency between stakeholders. Everyone is aligned and on the same page regarding planning and other decision-making.
- Alerts: The developer has set up numerous alerts for ongoing operations to monitor selected KPIs. These alerts notify the relevant team members whenever a threshold has been reached or if a metric requires immediate attention. This facilitates proactive moves to change vessel behaviors or rectify other performance points.
KPIs are not a one-size-fits-all set of metrics, and the developer has embraced the potential within SFM to make the solution their own. With personalized fine details, each point is guaranteed to be relevant, meaning the team can immediately identify critical performance markers within their operations.
Results
Smart Fleet Management has minimized the developer’s turbine unavailability by enhancing data quality to provide the insights needed to streamline operations.
DPRs ensure that operational data is error-checked, traceable, and accessible. The solution then consolidates and processes this data to provide the granular analysis needed to unlock optimized fleet composition and man-hours per turbine.
This centralized source has also reduced the risk of unforeseen costs and miscommunication across teams. All stakeholders, from site-level management to onshore teams, can now easily access their required information. This allows them to undertake comparison and benchmarking exercises for performance and contractual agreement follow-ups.


.jpg)

.jpg)