.jpg)

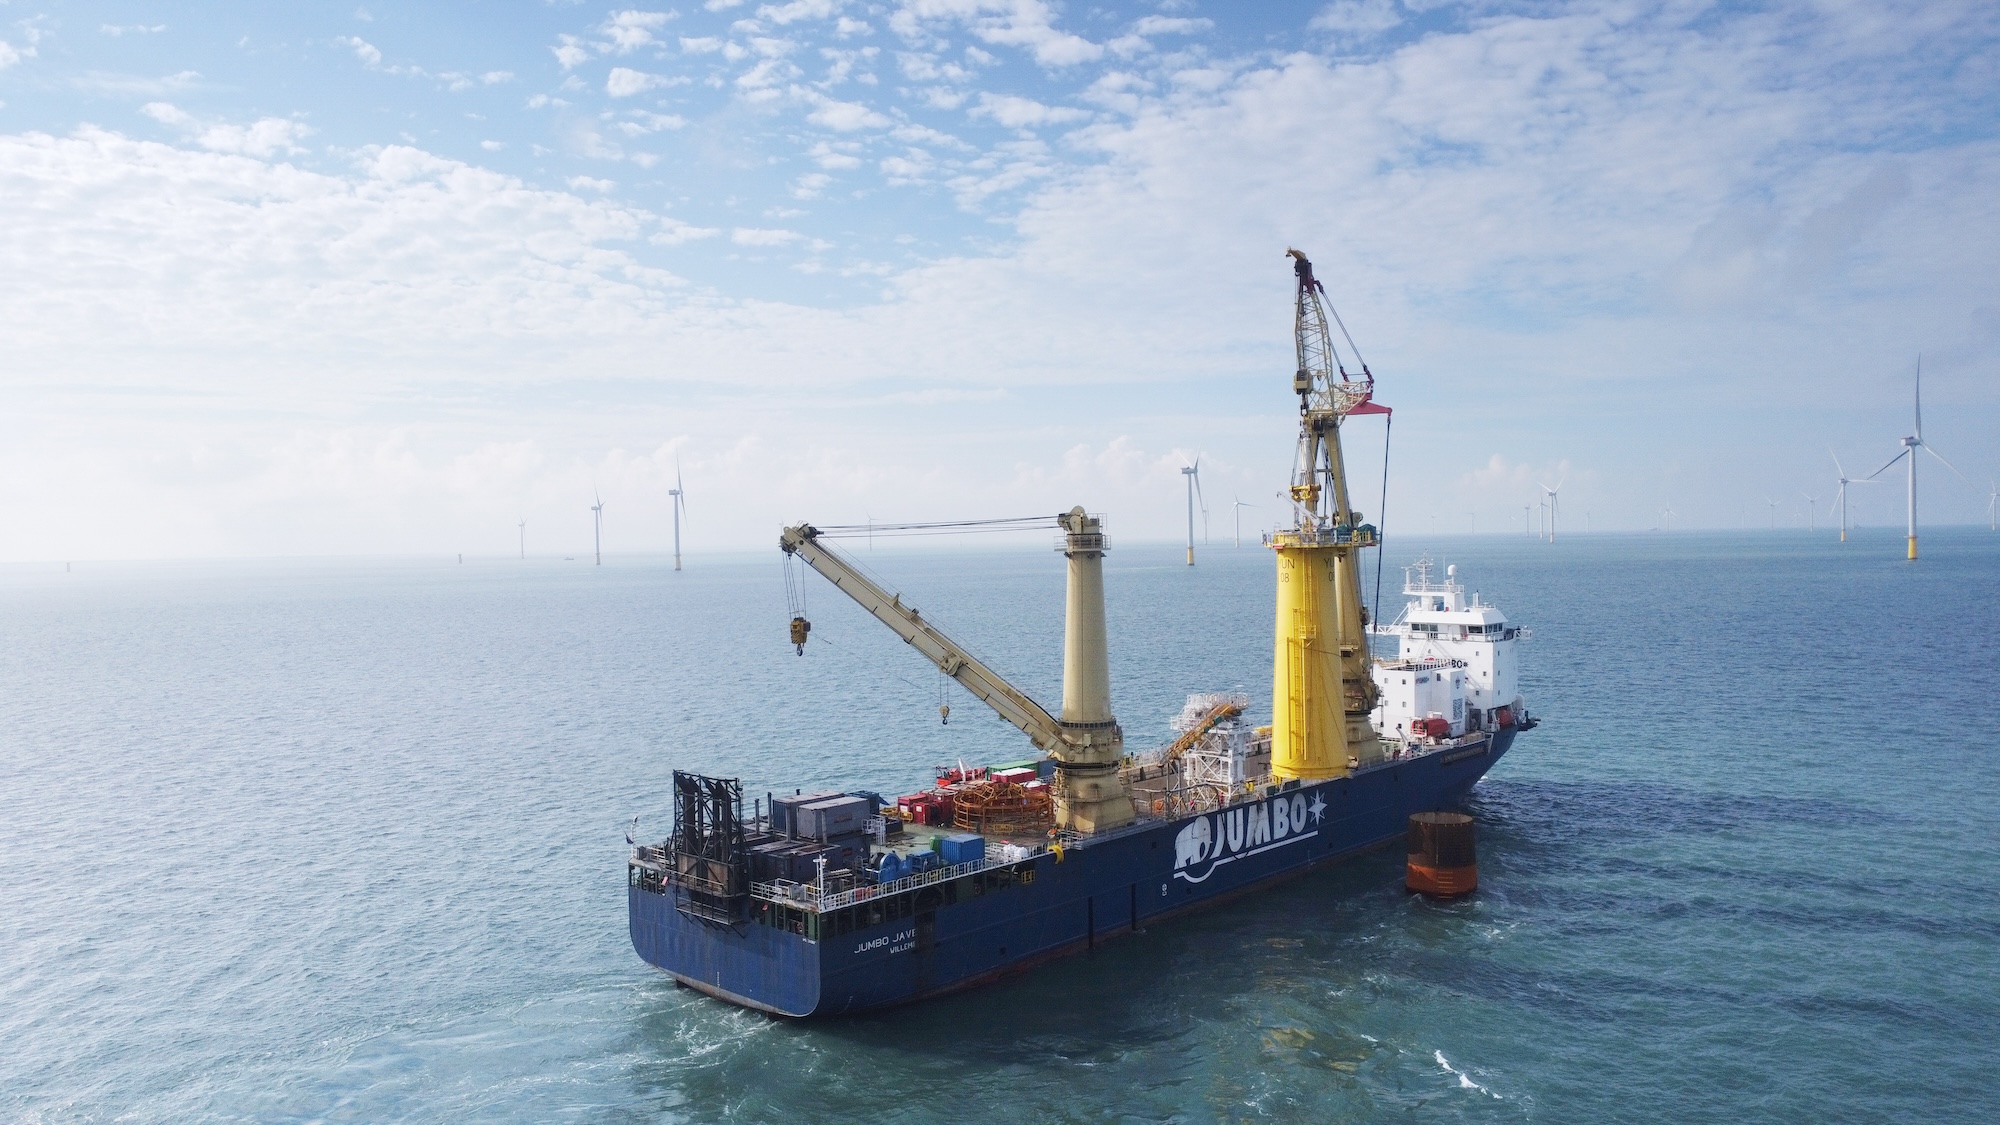
Spinergie’s client is an international offshore marine and support transport services company with a diverse vessel fleet. The client’s FSIVs, PSVs and liftboats are predominantly deployed across oil and gas, and offshore wind projects.
Challenge: maximising fuel performance and fleet reliability
The client wanted to understand the performance of each vessel in their fleet and identify the positive or negative drivers behind those performance levels. While they knew inefficiencies were occurring, these had been almost impossible to quantify, and any manual analysis was extremely time-consuming.
This left the client knowing overconsumption was happening, but without knowing why. They needed a solution that could explain the "whys" and quantify their impact.
Spinergie’s Solution
At the heart of the Vessel Performance module is a speed-to-fuel model built from actual consumption data, taken from reports and sensors, which is normalised against factors including speed, weather, draft, and time. This allows for the prediction of fuel consumption in any condition and the tracking of degradation over time. The module uses two performance levers—technical and operational—to compile optimal performance: i.e. the ideal consumption of a vessel based on its fuel profile.
- Technical Performance tracks detailed hull and propeller degradation (e.g. biofouling) as well as the ROI from dry docks or vessel upgrades, such as anti-fouling systems and ESS installations.
- Operational Performance examines how the vessel is being operated and its effect on actual consumption. This includes inefficient behaviours such as "hurry up and wait", overspeeding, generator optimisation (identifying whether too many generators are running), and spending too long in DP.
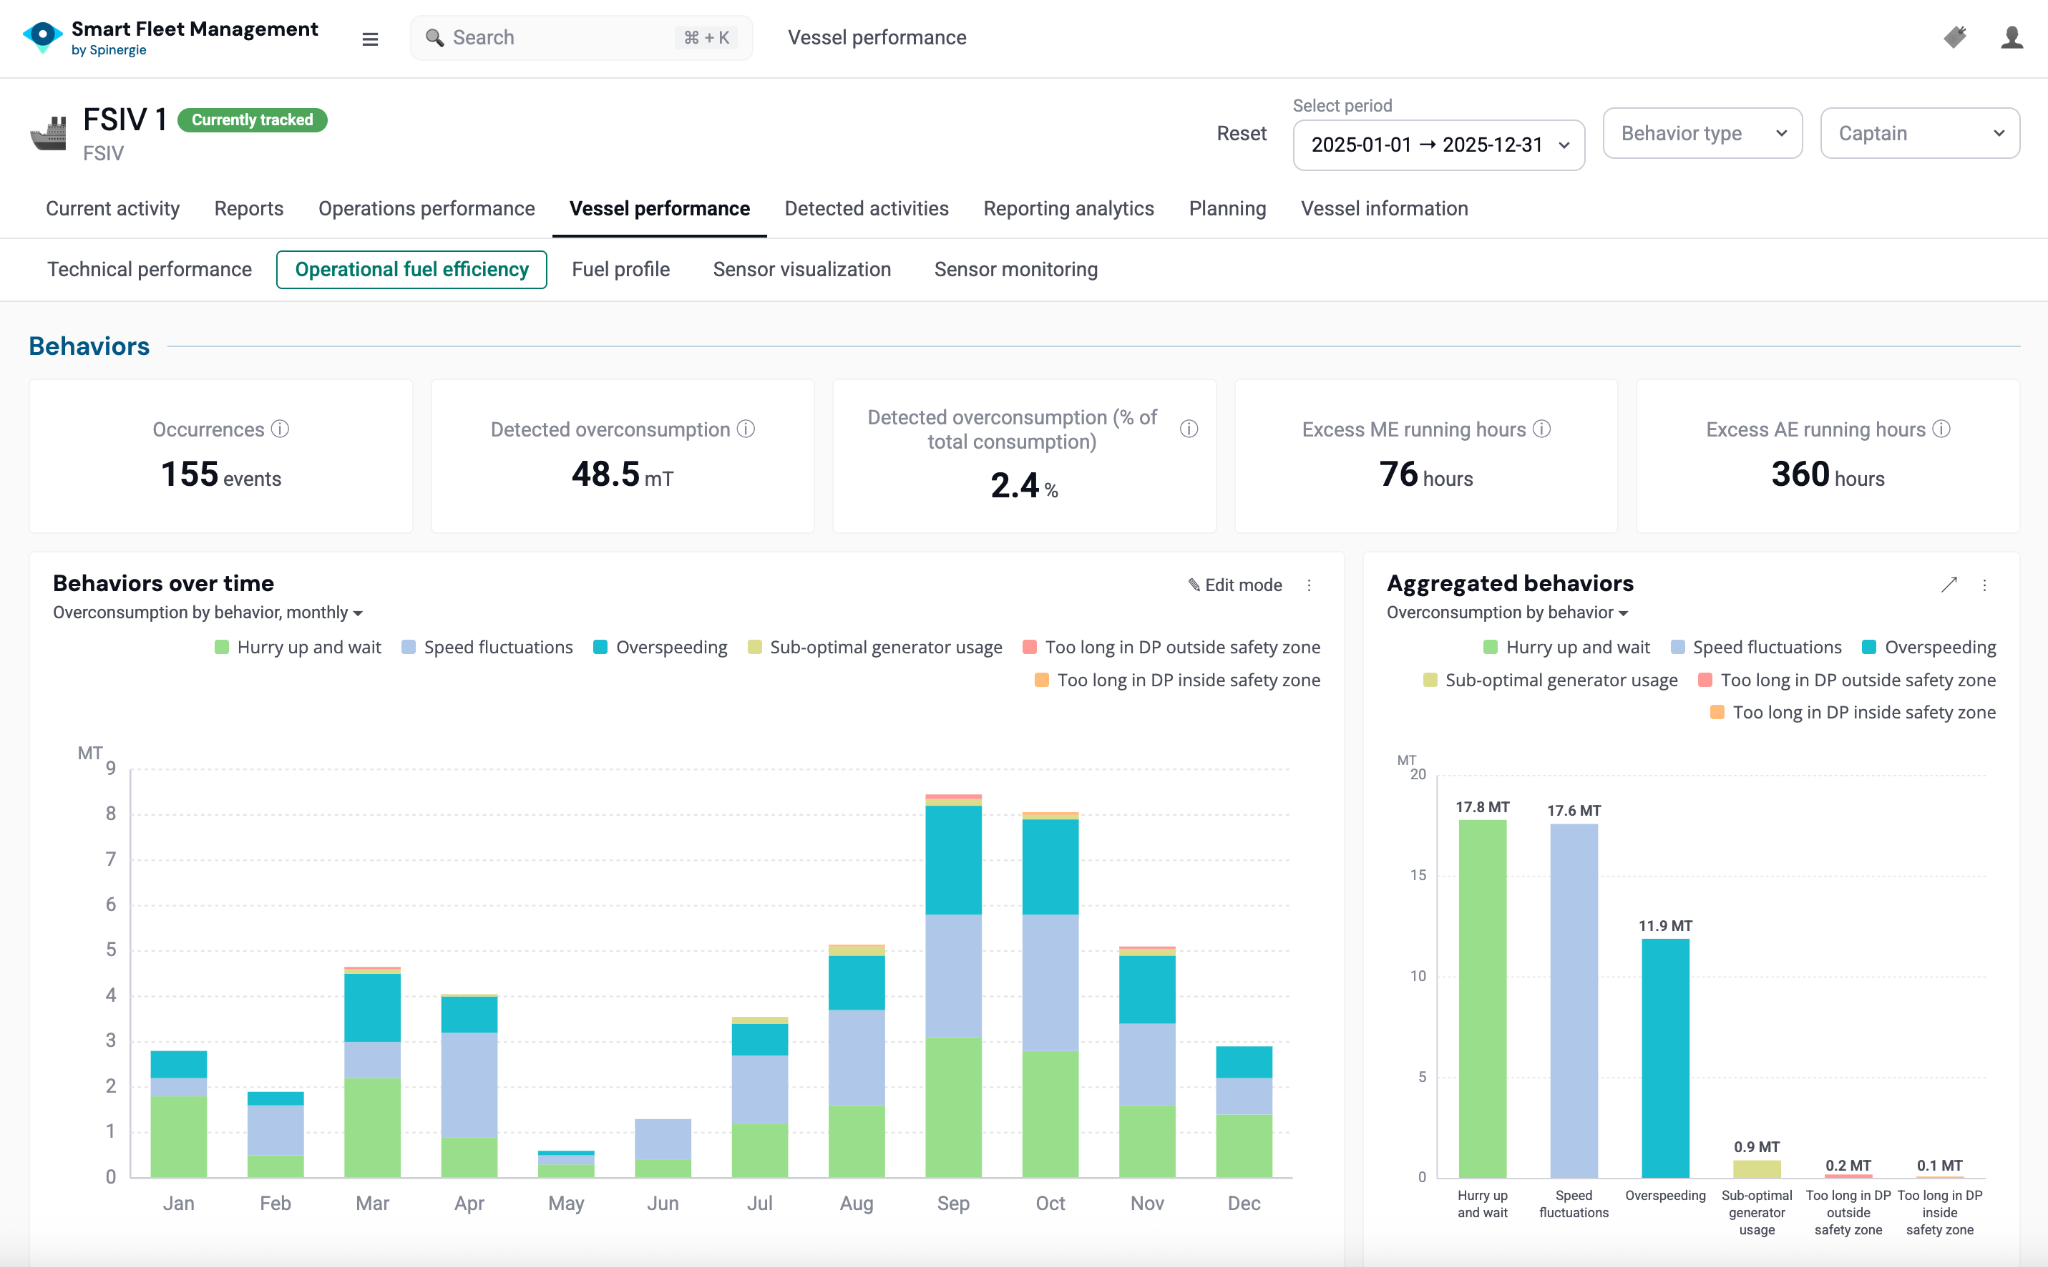
How Operational Performance is measured
Spinergie uses location data to identify patterns associated with inefficient behaviours. This can be achieved with or without sensors, as the only requirement is a ‘speed-to-fuel’ model to calculate overconsumption. Associated overconsumption (in MT and as a percentage of total consumption), excess main and auxiliary engine running hours, and behaviour counts are then quantified.
Clients receive these metrics via a user-friendly dashboard of KPIs, charts, and tables at fleet and vessel level, linked to schedule and map views for additional context. Further customisation is available through fine-tuning of behaviour thresholds and detected behaviours to suit the client’s operations.
Vessel Performance in action
Measuring declining performance over time
An FSV in the client’s fleet was tracked over time to help them understand the effectiveness of upgrades and maintenance works on reducing fuel consumption. The vessel had a dry dock in May, including a hull clean and repaint, which improved fuel consumption by 9%. In the following six months, the vessel performance degraded by 13%, resulting in 88 MT of overconsumption in 2025. This rapid degradation was caused by the vessel operating in warm equatorial waters and being idle more than half the time.
Understanding the cumulative effect of inefficient behaviours
In addition to the degradation following the dry dock, it was found that during Q1, there were over 30 instances of ‘’hurry up and wait’’ and speed fluctuation occurrences which each resulted in an excess fuel burn of 18 MT. There were also 18 instances of over-speeding, which resulted in an excess burn of approximately 12 MT.
Aside from these behaviours, Generator Optimisation analysis showed 360 avoidable running hours. This was with significant contributions from Excess DP inside and outside the 500 mz (41 and 35 hours, respectively.)
Result
The performance analysis of one Fast Support Vessel (FSV) over the course of last year showed a fuel overconsumption of 8.4%. This equates to approximately $144,910 (based on a fuel price of $860/MT)—representing a significant addressable opportunity to make fuel savings for this vessel. A maintenance cost savings by reducing running hours was also calculated. At 436 hours, this represents $2,180 in accelerated mtce spend (based on a RH cost of $5/hr).
With this knowledge, the client is now able to take actionable steps to improve the fuel consumption of underperforming vessels. They can now also continuously monitor performance from shore, to ensure recommended procedures are being implemented, and measure the impact of these changes in real time. The client is also now better equipped to provide firm vessel performance commitments in tenders and data-backed responses to customer queries or vessel performance claims.
Request a demo today to find out how Spinergie Smart Fleet Management can help you uncover the operational behaviours that are impacting your fuel spend.
Our team will show you exactly how we can adapt the solution to your needs.