Maélig Gaborieau
,
Senior Offshore Wind Analyst
Author
, Published on
March 23, 2026
No items found.

UK offshore wind AR7 awarded 8.4 GW across six projects, boosting long-term CfD certainty and driving demand across the UK offshore wind supply chain.
Six offshore wind projects, totalling 8.4 GW, were awarded by the UK Government in Allocation Round 7 (AR7)—3.1 GW more than announced in the sixth round.
Each project has secured a 20-year Contract for Difference (CfD)*, which provides long-term revenue visibility, in turn supporting the next phase of investment and development in the UK offshore wind sector. With CfDs secured, these projects will move toward Final Investment Decision. But what impact will this round have on the supply chain?
A Contract for Difference (CfD) is designed to support low carbon electricity generation. Offshore wind projects tend to have high upfront costs and long lifetimes which can be prohibitive to development. So, CfDs are designed to provide developers with protection from volatile wholesale prices while also protecting consumers from paying increased support costs when energy prices rise.
The CfD is a financial agreement where the government and developer exchange the difference in the value of the project between the contract’s beginning and end. With the Government paying developers when market prices are low, and developers paying back when market prices are high, this stabilizes developer revenue against volatile prices.
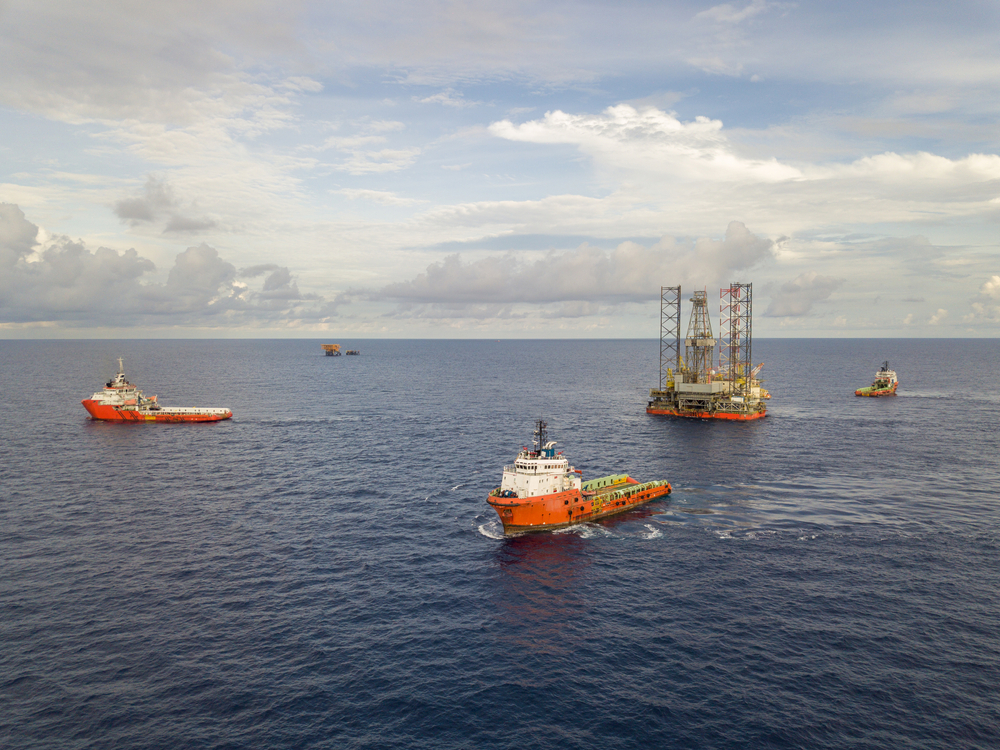
When looking at the supply chain impact of an offshore wind auction, or projects, there are three key categories: components, port infrastructure and installation vessel demand.
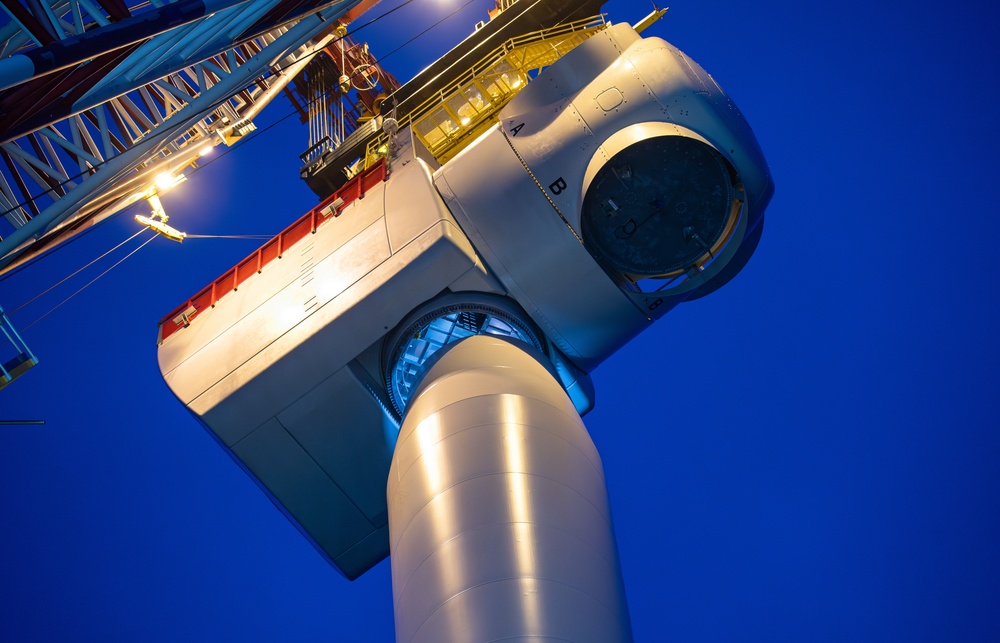
We estimate that this total awarded capacity of 8.4 GW amounts to around 542 turbines—the equivalent of a full year of nacelle manufacturing capacity from Siemens Energy, Vestas and GE combined. As a result, nacelles currently represent the most critical component-level risk to delivery timelines.
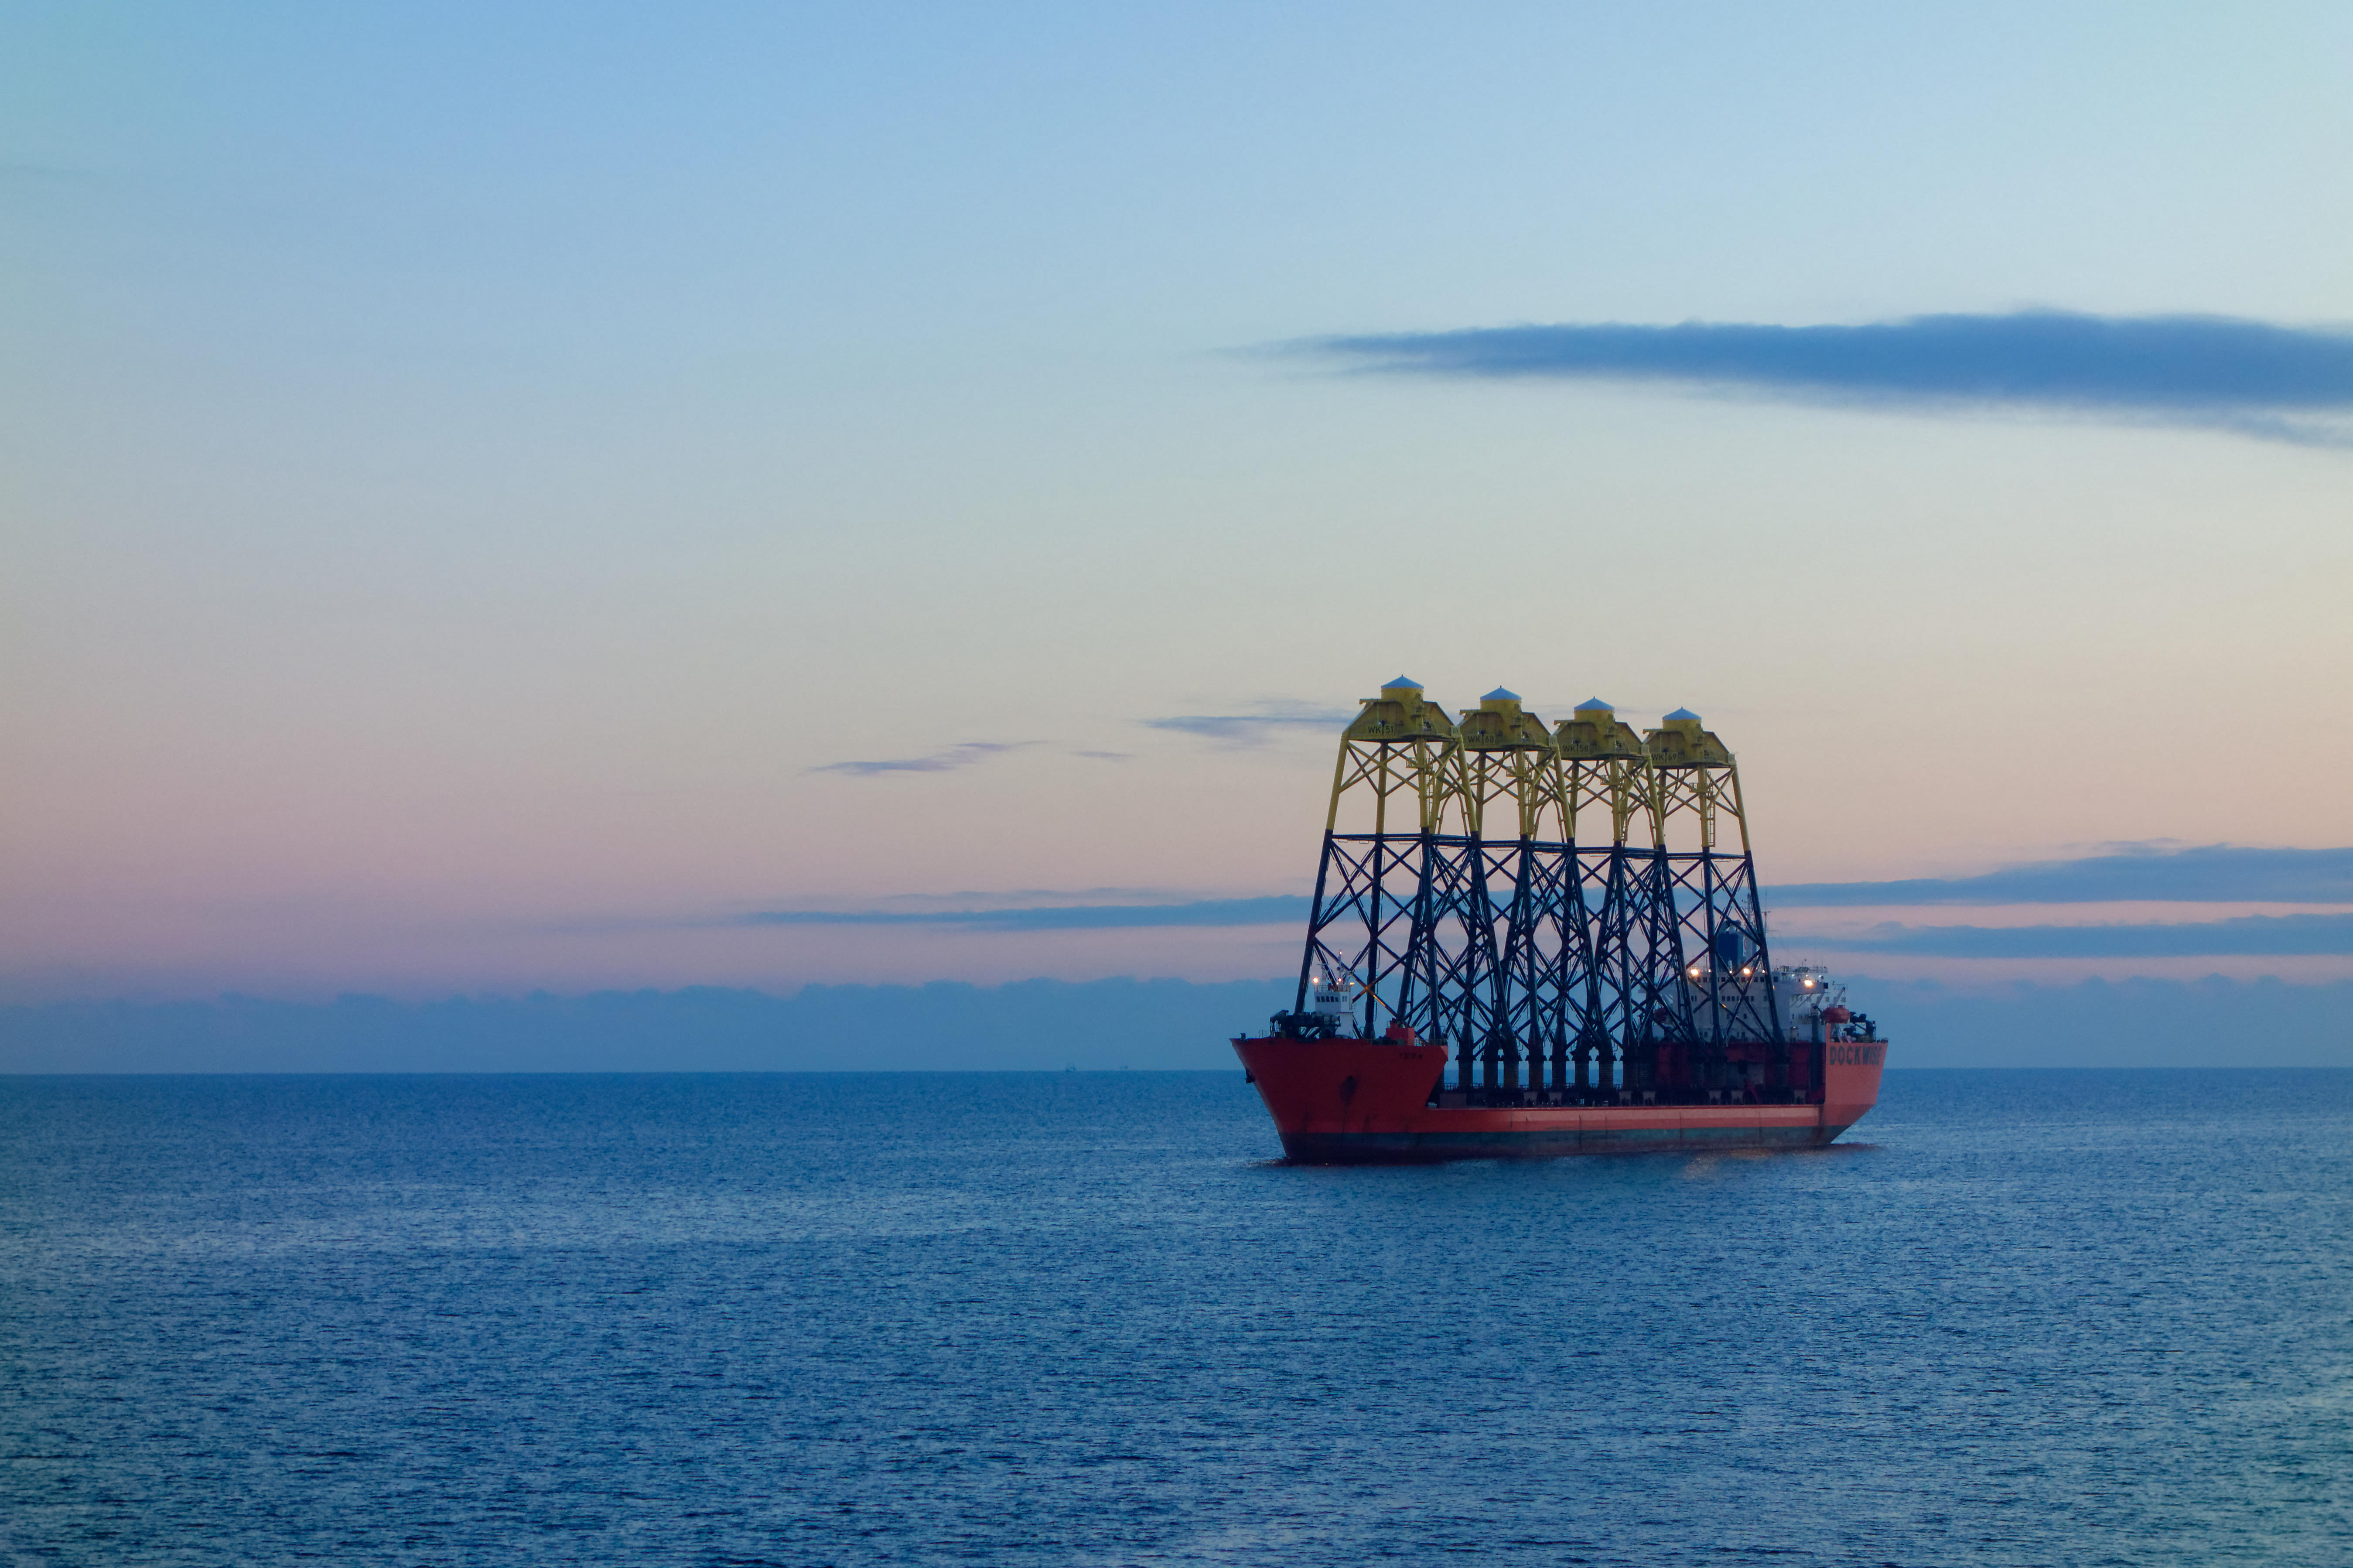
All of the bottom-fixed projects awarded, with the exception of Berwick Bank, would account for around 60-65% of the 700-monopile capacity held by European manufacturers each year. However, unlike turbines, Chinese foundation manufacturers have already been involved in European offshore wind projects, including the UK - the Inch Cape project being a key example - which provides some additional flexibility on the supply side.
For AR7 projects, turbine installation vessel demand is the equivalent of 53% of total demand in 2025 while foundation installation is 58% under the same measure.
These projects represent more than 5.2 vessel-years of FIV work for foundation installation, and around 4.0 years of WTIV utilization for turbine installation (assuming full-time deployment).
This raises a potentially high risk of bottlenecks as the global fleet will comprise just 23 jack-ups (excluding the Chinese fleet) capable of installing >15 MW turbines by 2030. However, the 20-year visibility offered by the CfD framework allows developers time to secure capacity well in advance.
It should also be noted that RWE has already long-term chartered Jan De Nul’s Les Alizés until 2030, with an option for an additional year, and Voltaire until 2031, also with an extension option, significantly reducing vessel availability risk for those projects.
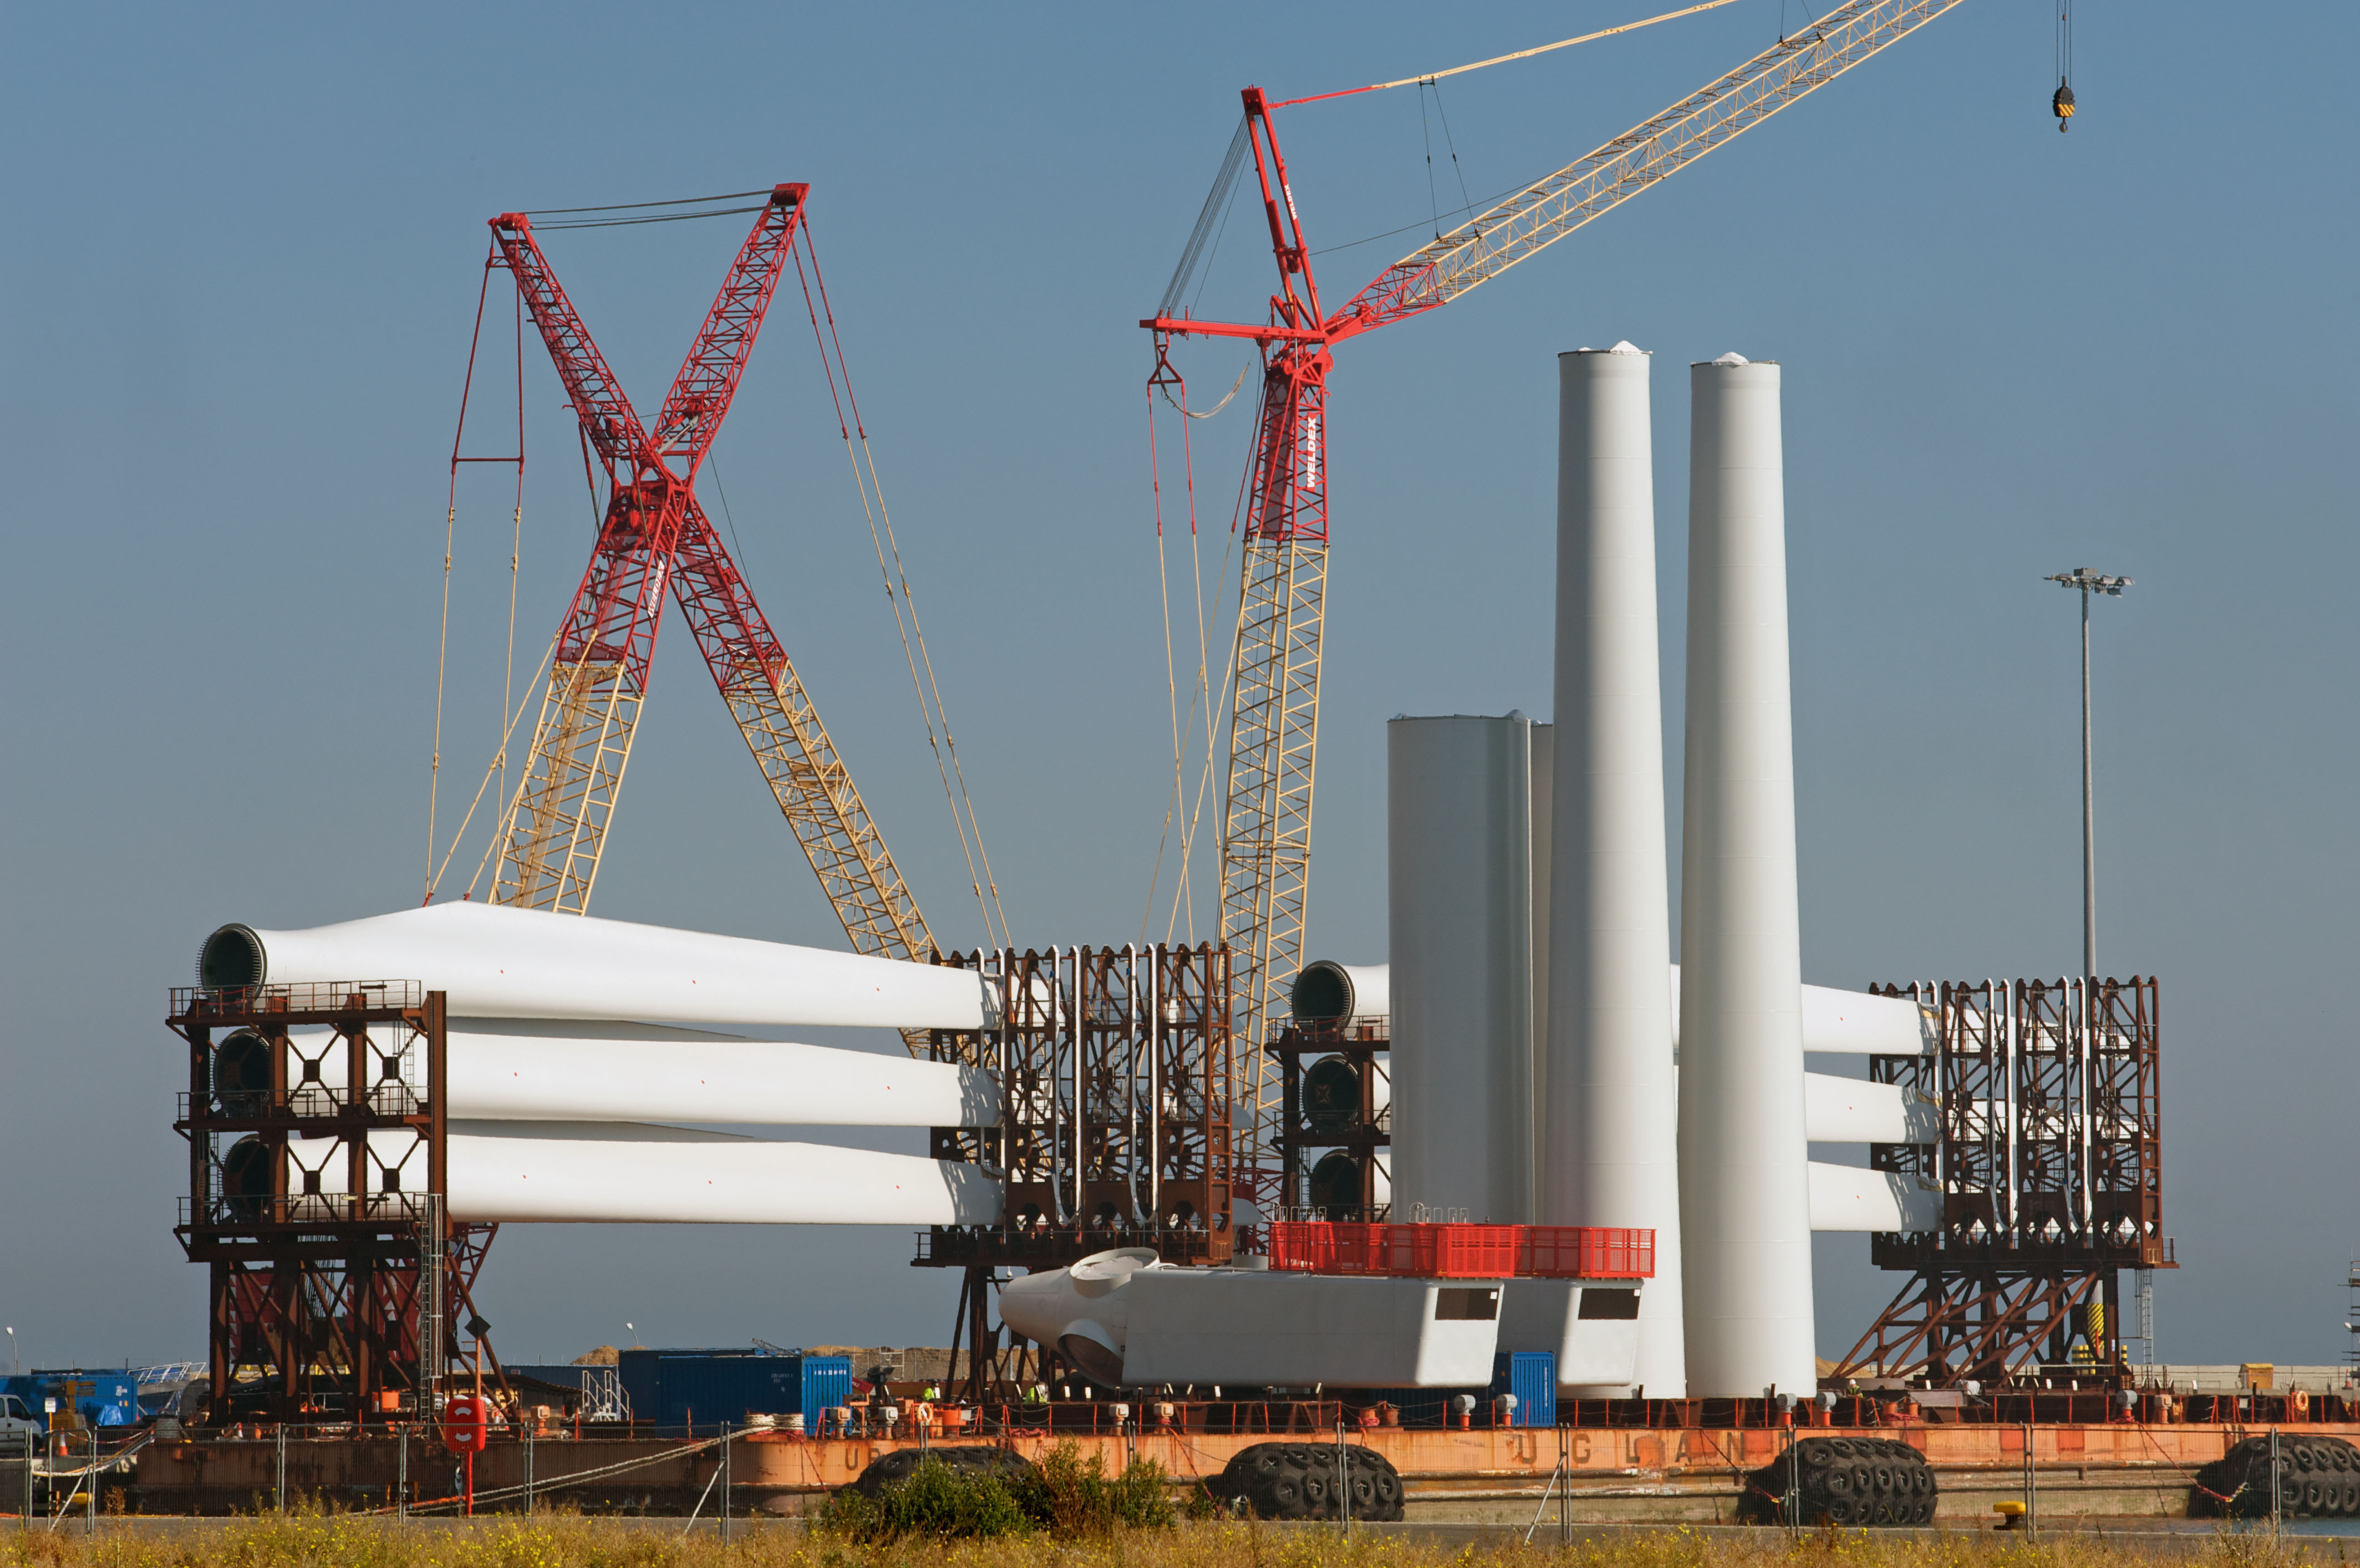
UK port infrastructure is well developed and capable of supporting large-scale offshore wind programmes. In practice, blades and other major components are delivered progressively and installed on a rolling basis, rather than stored simultaneously, which significantly reduces pressure on lay-down space.
While local congestion risks may occur at certain ports, port infrastructure is not expected to be the primary system-wide bottleneck.
In terms of installed capacity, the UK is already the world’s largest offshore wind market outside of China. This position is expected to be retained if projects are delivered as planned. However, any concentration of demand over a short timeframe increases execution risk.
The UK’s grid readiness is a key outstanding question. For example, due to limited grid capacity, SSE’s Seagreen offshore wind farm only generated around 1,040 GWh in the year to March 2025, despite having the capacity to produce approximately 4,590 GWh.
Read More: 5 supply chain lessons learned from analysis of a North Sea offshore wind farm
Overall, the AR7 announcement is clearly positive for the offshore wind sector. The 20-year CfDs provide long-term visibility on project pipelines, which is essential for developers to plan construction schedules, secure vessels and equipment, and manage risk.
More importantly, this visibility extends across the wider supply chain, giving other stakeholders the confidence needed to commit capital and scale capacity. That level of certainty is what ultimately unlocks investment, supporting industrial growth.
Spinergie’s Supply Chain module helps you answer fundamental questions about the supply chain attached to specific projects and track market impact.
The module outlines what components and their specifications have been used at each project, who the manufacturers of those components are, and where they were fabricated. The story is completed by analysing how those components are transported and the ports used for storage, lay-down, and pre-assembly. Find out more by requesting a free demo.
Read More: The Offshore Wind Supply Chain: Using close analysis of past performance to optimize planning processes.