
This use case shows how a developer used the in-depth vessel performance analytics, historical data, and market trends within Spinergie Market Intelligence to plan an export cable lay scope.
Context
The client was undertaking the planning and development phase of a bottom-fixed wind farm project in a mature offshore wind region. They needed to better understand vessel performance during the export cable laying phases of previous projects in the region.
Challenge
By using intel on projects of a similar size and scope as their upcoming wind farm development, the client could confidently forecast this element of the construction phase. They wanted analysis to be as user-friendly and efficient as possible, with all relevant data and contextual information available in a single source. This would:
- reduce a steep learning curve for the team;
- minimize the need for them to undertake training programs for multiple sources;
- eliminate the need to use a third-party solution to consolidate their learnings.
Spinergie Market Intelligence
Spinergie Market Intelligence presents in-depth vessel performance analytics alongside contextual data—context was crucial for the client to understand specific impacts, such as seabed type, on a like-for-like basis. Here, we outline which tools the client used within the solution to build their analysis.
The Live Map
The map contains multiple layers from cables to geography, such as seabed sediments and weather, to pinpoint similar conditions cable-lay vessels have operated in.
Historical weather pattern data helped the developer assess the feasibility of different cable-laying schedules while building on their knowledge of previous experiences with similar seabed sediments helped the developer plan for the cable lay programme.
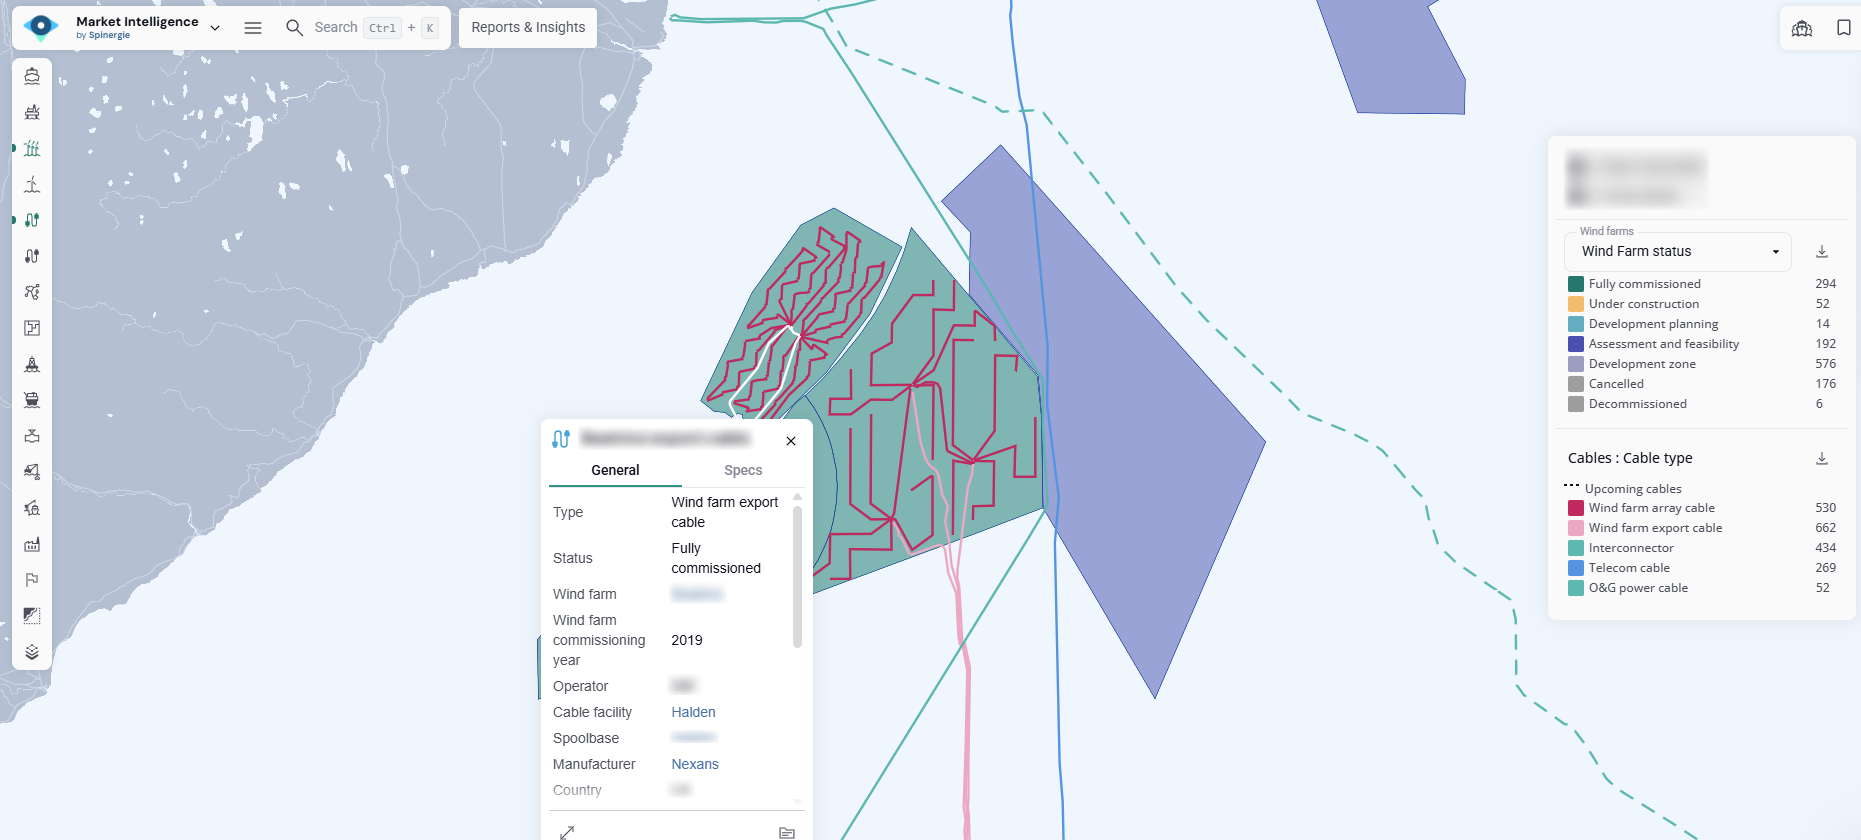
Cables
The cable map layer illustrates the global cable landscape with clear colour coding indicating the type of cable and their locations. The client found it straight-forward to select the cables most relevant to their research. Using tooltip data, the client had easy access to high level data such as project name, cable type, cable length, and water depth, as well as any spec details such as voltage, transmission type, and configuration. This helped them build a clearer picture of activity in the region before diving into the specifics.
Each cable laying section contains more project-specfic information including start and end dates of the installation, length and average speed of the vessel during the installation. The client used this data to gauge the general timelines expected for an installation programme in areas with similar geography to their upcoming project.
Market and fleet analysis
Equipped with a better understandng of the cable landscape, the client was ready to examine the cable lay vessel market. With access to the details of over 90 active and under construction CLVs, the client used advanced filtering and selection tools, such as the Vessel Comparator, to shortlist the vessels that fit their project scope.
With shortlist in hand, the client wanted a comprehensive view of fleet dynamics to understand current and future dynamics. Using the Fleet Analysis dashboard they could answer questions including:
- How many vessels within our required specifications are currently laid up, and how many are on hire?
- What is the average age of vessels that meet our specifications?
- Where are the majority of the selected vessels currently based?
- How many vessels meet our specifications and will any further vessels be delivered within the next two years?
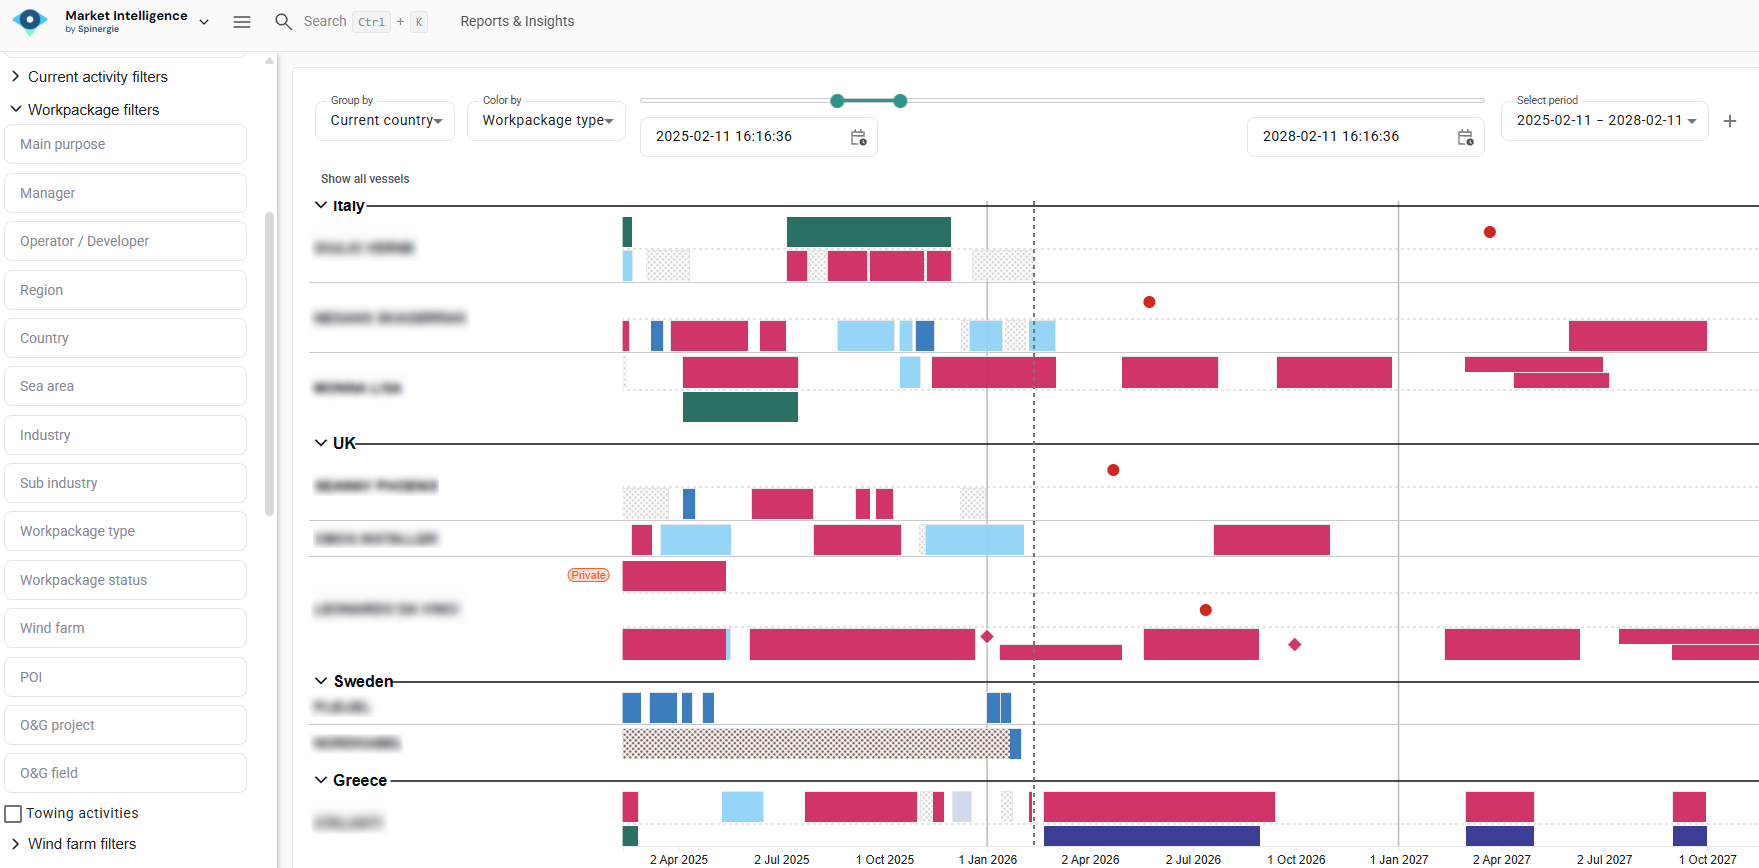
The next step was to use the vessel schedule for a visual representation of how active each of the shortlisted vessels had been in recent years and seeing what futureprojects are already booked. The client also used this dashboard as a communication tool with annotation capabilities allowing them to flag important comments and keep everyone informed.
Cable Performance
Spinergie’s Cable Performance analysis is split into two dashboards: Export/Power and Array. The client sought to understand export performance; however, the array dashboard contains a similar analysis but is calculated differently.
By using the analysis in this dashboard, the client could answer:
- Which of their shortlisted vessels performed best in laying wind farm export cables.
- Which vessels have the most experience, i.e., overall km of cables laid.
- Which of the vessels had the fastest laying speed for wind farm export cables.
Using the Laid Cable Summary chart, the client could see an overview of the types of projects selected vessels had previously undertaken (wind farm export cable, interconnector, or oil and gas power cable) and the number of days (or km laid and spooling days) the vessel had undertaken for each sector. This gave a good indication of each vessel's experience in wind farm export work. For future analysis, the client can revisit this chart and select additional metrics to understand each vessel's experience with other market elements, such as cable manufacturers or developers.
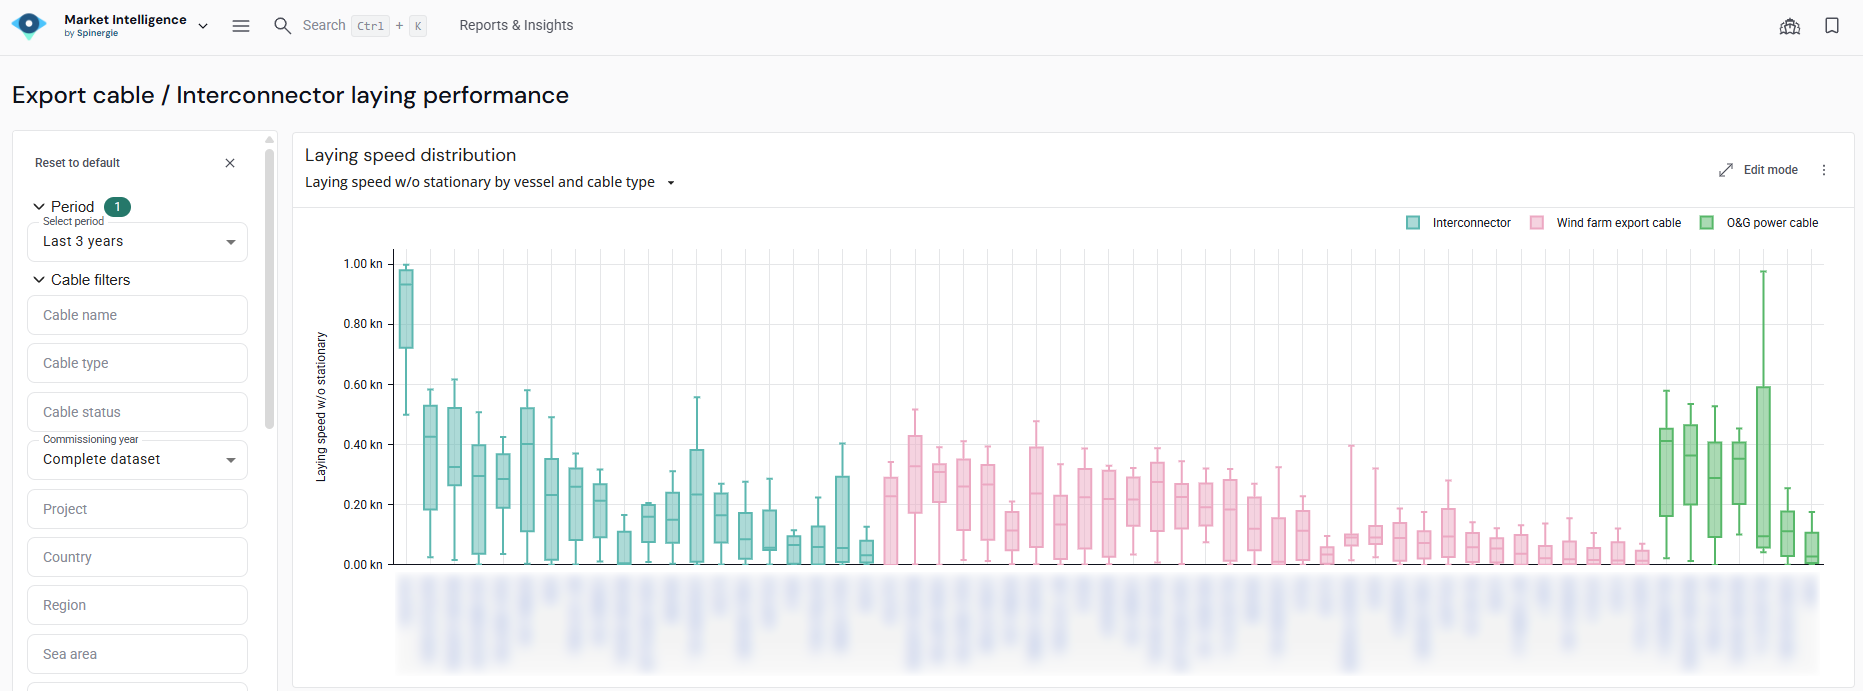
The Laying Speed Distribution chart is the heart of the performance analysis dashboard. It depicts, in knots, the speed of each vessel when laying each cable type. Understanding the laying speed distribution helpdthe client estimate the time required for their export project, allowing them to allocate resources (vessels, personnel, equipment) more effectively. It also helped them calculate probable fuel consumption and the project duration, leading to more accurate cost and emissions estimates.
Finally, the Cable Laying Vessel Days Analysis provides a breakdown of days spent on the campaign quantified by the portion of cable laid (in km) and broken into activity types. This helped the client visualise the amount of “productive” time spent per section (i.e., time spent in the actual laying process vs. auxiliary activities such as ashore, transit, etc.).
Result
Spinergie Market Intelligence streamlined the research process for the client. By using a single platform for research and communication the team were able to easily track and share progress and annotations.
Using the vessel analysis tools, the client accurately assessed technological capabilities and capacities to build a shortlist before performance analysis. This was a significant time-saver, as it meant the client could discount several vessels based on capabilities or availability and only undertake performance evaluations of their curated shortlist.
Performance analysis gave the client a clearer idea of each shortlisted vessel's prior experience and performance, i.e., speed, to date. This helped the client create realistic project timelines and build contingency plans into the scope. It was also a significant factor in refining their cost estimates for the cable lay project and aided resource planning.
Understanding previous cable lay vessel performance was essential for the client to plan a successful and efficient cable lay programme and make informed vessel choices and project planning decisions including risk management and cost estimation.

Our team will show you exactly how we can adapt the solution to your needs.
.jpg)